


Science is in the business of finding cause-effect relationships between things in the natural world—discovering how changes in one quantity cause changes in another. The quantities that scientists record and manipulate are called variables. Scientists elucidate the causal structure of the world by manipulating variables to see how changes in one variable affect changes in other variables.
In the context of scientific experimentation, there are two main kinds of variables: The independent variable is the parameter that is changed by the scientist to test the truth of some hypothesis. The response variable is the variable that the scientists are trying to measure a change in by changing the independent variable. The response variable is sometimes called the dependent variable as its value is dependent on changes to the independent variable. The concepts of independent and response variables roughly map onto the common sense understanding of cause and effect.
Example of Independent/Response Variable
Here is a simple example of independent and response variables in action: Say you are trying to test the effect that different kinds of UV light have on the growth of a particular kind of plants. You set up and experiment with three different plants and three different kinds of UV lights, no UV, moderate UV, and high UV. Our hypothesis is that the more intense UV light the plant is exposed to, the better it will grow.
In this experiment, the independent variable is the intensity of UV light. This is the variable that is explicitly manipulated by the experimenter. The response variable is the observed growth of our plant, the variable that is affected by our change to the independent variable. The purpose of our experiment is to see if there is a positive correlation between the intensity of UV light (independent variable) and the observed growth of the plant (response variable). By running our experiment, we can see if changing the value of our independent variable correlates with changes in the value of the dependent variable.
Graphing Experimental Results
Often times, it is helpful to summarize the information of an experiment in a graph that gives a visual representation of the relationship between the independent and the response variable. Returning to our hypothetical plant experiment, say we were to graph our results. One way of doing this is to have the x-axis represent the independent variable (UV intensity) and the y-axis represent the response variable (plant growth). Graphing experimental results in this manner allows one to better visualize any relationship between the independent and response variable.
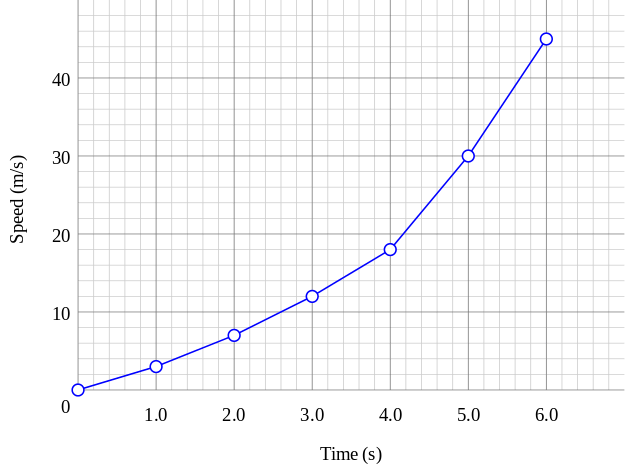
Speed is represented as a function of time. Time is the independent variable, speed is the dependent variable. Credit: WikiCommons CC0 1.0
Control Variables
Return to our hypothetical plant experiment. Imagine we place each of the plants in a different room with different temperatures, or we exposed them to light for unequal amounts of time, used different species of plant, or difference in how much water each plant gets. These variables could affect the value of the response variable, yet they are not the variables that we are investigating. This is why it is important in scientific experiments to have control variables. Control variables are variables that could have an effect on the response variable but are not the focus of the experiment. Control variables are the values that must be kept constant in order to more accurately measure the effect of the independent variable on the response variable. That way, we can be sure that changes in the response variable are because and only because of the changes in the independent variable.
In our example, duration of UV exposure, amount of water, species of plant, and ambient temperature are all variables that could have an effect on the response variable. It is important to keep these control variables constant between each experimental situation. Keeping control variables constant allows us to be more certain that the change in the response variable is due to the change in the independent variable. If we did not keep control variables constant, then we would be less certain that any change in the growth of the plant is due to the intensity of UV light.
Keeping control variables constant also affords another important property of scientific experiments, reproducibility. Rigorously defining and maintaining control variables are what allow scientific experiments to be repeatable. If the control variables were not accounted for in the initial experiment, then another researcher may not be properly able to reproduce the experiment to see if the same result obtain.
Response Variable As The Effect
Under normal understanding, the independent variable could be considered the cause and the response variable the effect. By manipulating the cause (independent variable) we can see systematic and predictable changes in the effect (response variable). This is essentially what scientists mean when they talk about”causes” and “effects”: occurrences and changes in one variable are associated with occurrences and changes in another variable. A phrase like “smoking causes cancer” can be interpreted as saying that some changes in the independent variable (the activity of smoking) are associated with and can predict changes in the response variable (likelihood of developing cancer). These associations are illuminated by running properly designed experiments with controls.
Illuminating independent/response variable relationships is not the whole story to science though. Scientists also want to figure out the mechanism behind these relationships. We might know that a causal relationship exists between the two variables, but we also want to know the step-by-step mechanical details of how those two variables are related. In the case of smoking causing cancer, we know the mechanism behind the association: carcinogens in tobacco smoke induce a mutation in DNA, which makes cells begin to over-multiply. In other situations, we know that there is a causal relation between two things even without knowing the explicit mechanism behind that relationship. Scientists understood how genes get distributed in populations almost 200 years before the discovery of the DNA mechanisms behind hereditary.
Real-World Examples
Gas Behavior
Here is a real-world example of independent/dependent variable relationships found in most high-school chemistry textbooks: It is a well-established fact of chemistry that the pressure and volume of a gas are inversely proportional. Specifically, Charles’ law tells us that for a fixed quantity of gas at a constant temperature the product of the pressure and the volume is constant. Mathematically that is:
PV = k
Say we have a sample of gas in a flask with a rubber stopper on the top. We record the volume and pressure. Next, we begin to push the rubber stopper down to decrease the volume of the gas. As the volume decreases, we notice that the pressure of the gas increases.
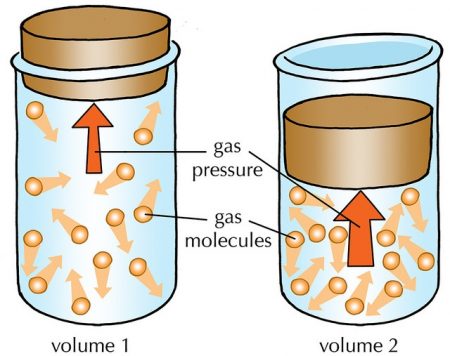
This scenario is a perfect real-world example of independent, response, and control variables working together. In our experiment, the independent variable is the volume of the gas; i.e. the parameter the experimenter is directly manipulating. The response variable is the pressure, the thing that changes in tandem with the change to the independent variable. Temperature is the control variable; the temperature is kept constant so we can be certain that the change in pressure is not due to a change in temperature.
Optimal Drug Dosage
In the context of medicine, a researcher could test how the quantity of drug administered affects the severity of symptoms by observing the frequency and intensity of symptoms associated with different drug doses. In this situation, the independent variable would be the administered dose and the dependent variable would be the frequency and intensity of symptoms. We could determine the optimal dosage by comparing how changes in dosage affect the presence of symptoms. The control variables in this situation could be the time of dosage, method of administration, etc. Keeping these controls constant allows experimenters to be sure that any change in the frequency or severity of symptoms is solely due to the dosage amount.
Nutrition
Say a nutritionist is attempting to determine the effect a new vitamin supplement has on workout performance. The could figure this out by comparing any change in exercise performance to changes in the dosage of the vitamin. In this situation, the vitamin supplement is the independent variable and exercise performance is the response variable. We are specifically looking for whether or not taking the vitamin has a positive effect on exercise performance. The control variables could be calorie intake, amount of sleep, and hydration levels.
To recap, in the context of science, the response variable is the observable quantity that we are trying to induce a change in by changing the independent variable. The independent variable is the parameter that is directly manipulated by experimenters. The purpose of a scientific experiment is to chart out the relationship between the independent and dependent variable to see if there are any causal relations between them. Control variables are important because they allow us to be sure that any change in the response variable is solely due to the independent variable. One can consider the concepts of independent/response variable as roughly synonymous with the intuitive notion of cause and effect.
Related Posts
 Improving Tools For Quality Improvement: Crossings, Runs, And Crossrun
 Coherent Poly Propagation Materials With 3-Dimensional Photonic Control Over Visible Light
 Reconstructing Commuter Networks Using Machine Learning And Urban Indicators
 Surprising Internal Structure Of Whole Wheat-Green Gram Functional Bread
 Tailoring Tomatoes To Match Individual Consumer Needs
 Eavesdropping On “Classroom Talk” In Undergraduate STEM Classrooms