


To maintain and improve quality in, for example, industry and healthcare, one has to understand the processes involved. All too often healthcare managers use shortcuts based on one single observation, with detrimental results. A number of charts to understand the processes over time have been developed and implemented in generally available software.
Common to all these tools is the need to distinguish between processes with random and non-random variation. As long as there is random variation only, one should engage in long-term efforts toward quality improvement. When non-random variation is detected, the reasons should be identified, and actions should be taken to bring the process back on track. Run charts constitute one tool that has proven useful in this respect. Run charts use two quantities, crossings and runs, both related to a midline. The midline is often the median from a previous stable period. In the following hypothetical sequence:
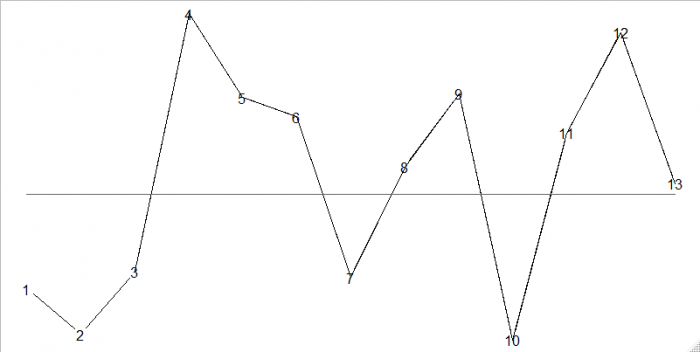
Figure courtesy Tore Wentzel-Larsen
there are 13 consecutive data points. There are crossings of the midline from time 3 to 4, 6 to 7, 7 to 8, 9 to 10, and 10 to 11. Also, the longest run, at one side of the midline, occurs at the time of 4, 5, and 6. Thus, there are five crossings, and the longest run is three.
Crossings and the longest run are used together to identify non-random variation. Specifically, non-random variation is declared if there are unusually few crossings and/or an unusually long run. The boundaries are specified in the Anhøj rules (for example, see Appendix 2 here). For 13 data points, non-random variation is declared if there are less than three crossings or a run of at least seven consecutive points. Thus, the message in the figure above is to relax and keep on the long-term good work.
The Anhøj rules are based on heuristics for each of the two quantities separately. However, they are related; when there are few crossings the runs tend to be longer, and vice versa. As we will show in detail below, crossings and runs are in fact strongly related. While the Anhøj rules have shown to be useful for maintaining and improving quality in healthcare, previous investigations show that some characteristics of the rules tend to move a bit up and down when the number of data points increases, as shown in figure 2 here based on comprehensive computer simulations.
We have now done some work that largely eliminates the need for simulations. Specifically, we have been able to compute exact probabilities for crossings and runs taken together, for a variety of scenarios. Before we move into the details, this is a snapshot of what we found for a sequence of length 19 with random variation only:
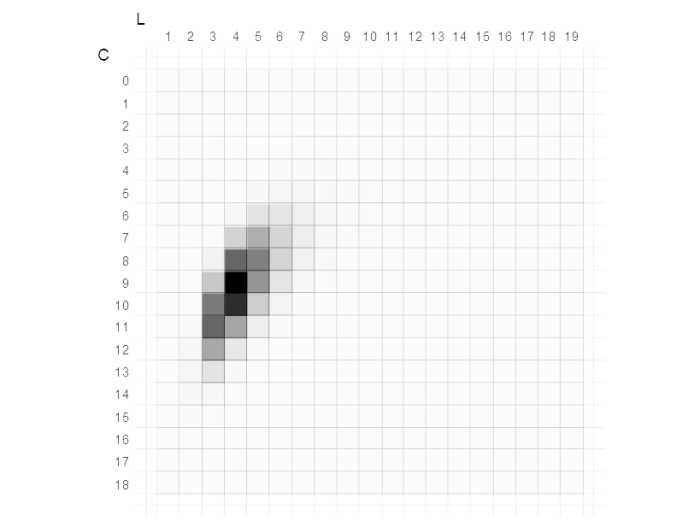
Figure courtesy Tore Wentzel-Larsen
Here, the number of crossings is shown in rows and the longest run in columns. The possible combinations are shown in gray, with the more likely combinations in darker shading. The two most likely combinations are nine or ten crossings, and the longest run is four. Crossings and runs are strongly related, and the more likely combinations occupy a small sloped region. There is, however, some leeway, and the figure shows exactly how much. If there is non-random variation, there are the same possible combinations, but the most likely region is shifted toward fewer crossings and longer runs.
While there was a lot of nitty-gritty to make these computations work, the basic idea is simpler. In the figure with 13 data points above, the first crossing is from time 3 to 4, marked with red in the figure below:

Figure courtesy Tore Wentzel-Larsen
The times after the first crossing constitute a sequence in its own right of the same kind as the full sequence. There are only two important differences: it starts on the opposite side of the midline, and it is shorter. Therefore, if the computations are already done for all shorter sequences, we may lump them together and solve the problems for sequence length 13 also. And so on.
In October 2018 we submitted an R package crossrun in which these computations were implemented. R is a free and open-source environment for statistics that is becoming increasingly more popular. An important reason for this is because of the R packages that are made available by researchers worldwide, extending the functionality of R. A large number of R packages are submitted each year. In fact, there were 185 new packages submitted during October 2018. Our recent article in PLOS ONE describes the conceptual basis for the procedures implemented in crossrun.
With these computations available, the road to a more detailed study of the performance of the Anhøj rules is open, without having to resort to complicated and less reliable simulations, and so is the road to proposing and investigating possible refinements of the rules. We are currently working in that direction.
Related Posts
 Coherent Poly Propagation Materials With 3-Dimensional Photonic Control Over Visible Light
 Reconstructing Commuter Networks Using Machine Learning And Urban Indicators
 Surprising Internal Structure Of Whole Wheat-Green Gram Functional Bread
 Tailoring Tomatoes To Match Individual Consumer Needs
 Eavesdropping On “Classroom Talk” In Undergraduate STEM Classrooms
 Game Designed To Innoculate People Against Fake News Help Increase Skepticism