


Part of the job of statistical analysis is to discern possible relationships between two or more variables. Two or more variables are said to be correlated if the value of one variable changes as the other variable changes, either increasing or decreasing as the value of the other variable does so.
If there is no correlation between two variables, it means that the variables do not appear to be statistically related, that the value of one variable doesn’t increase or decrease in association with the increase or decrease of the other variable.
Definition of Correlation
A correlation is a measure of a statistical trend, showing possible or perceived relationships between two or more variables. A correlation is usually expressed as a number and it describes the direction and size or magnitude of the relationship between two variables. If one variable increases in accordance with the other variable, the variables are said to have a correlation. If the data points of the variables don’t align, if the increase or decrease of these variables seems random, it is said that there is no correlation. An example of a correlation between variables could be “income earned” and “hours worked”, or “energy usage” and “temperature” (assuming that as temperature decreases more energy is needed to heat a home).
It is important to remember that a correlation cannot prove causation. Causation is the assertion that one event causes or results in the occurrence of the following event. This is cause and effect. The reason that a correlation cannot prove causation is that there can always be other variables which are influencing the occurrence of one of the target variables.
Establishing a correlation is much easier to do compared with clearly establishing cause and effect.
Why Investigate Causation and Correlation?
Without knowing how variables are related to one another, it would be difficult to advocate for changes in policy or new programs that could benefit society or lead to new technology. Research is frequently done with the goal of identifying how variables are related to one another, and then policymakers and advocates often use this research to create new policies. For instance, if we wanted to know whether or not a person’s education was predictive of their earnings, we would track how these two variables are correlated.
Here are some other questions we could investigate the correlations of:
- Does where people live impact their health?
- Was a marketing campaign successful at increasing sales?
- Is environmental concern correlated with education?
- Has a pollution control policy successfully cleaned up an area?
Measuring Correlation
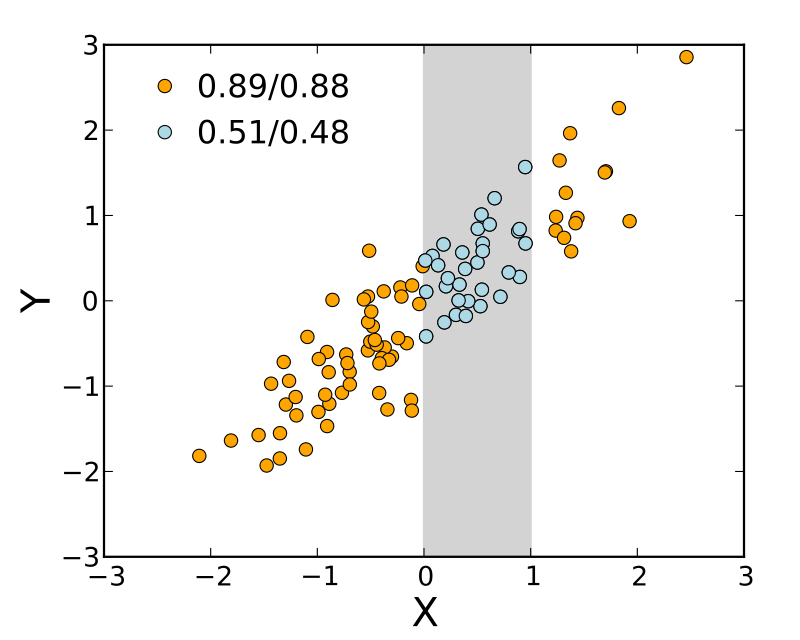
When determining the correlation between two variables, the system of measurement used is a correlation coefficient. A correlation coefficient is a number that represents the intensity of the relationship between the two different variables. Correlation coefficients range from -1.0 up to 1.0. The distance of the coefficient from zero represents both the direction and strength of the relationship between the variables. A positive value for the correlation coefficient means that there is a positive relationship between the two variables, or that both variables shift their values in the same direction at the same time. A positive correlation means that as one variable increases the other variable must also increase, and as the first variable decreases, the second variable also decreases.
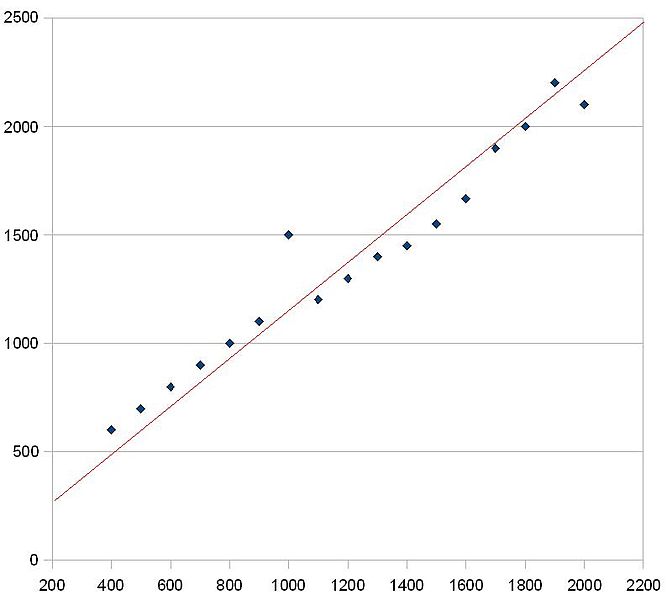
Example of graph for positive correlation. Photo: Benbenthehen via Wikimedia Commons, CC-BY-SA 3.0
By contrast, a negative valued correlation coefficient shows that the two variables have a negative relationship, or that the value of the variables are inversely correlated with one another and move in opposite directions. As the first variable increases, the second variable decreases and vice versa.
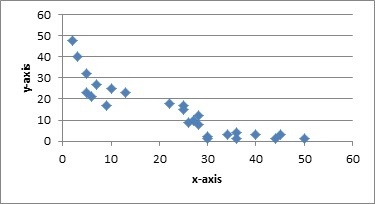
Example of a negative correlation on a scatterplot. Photo: Monika Wahi via Wikimedia Commons, CC-BY-SA 4.0
There are limits to using the correlation coefficient as a measure of a relationship between two variables. One limit is that the correlation coefficient is usually used to measure linear relationships and the correlation coefficient may be skewed in nonlinear relationships. As an example, at a job with a set wage, one would expect income earned and hours worked to increase together in a roughly linear fashion since with every hour worked, income should increase by the same consistent value. However, if a person’s income is scaled, (such as at a job where a fee is charged for initial setup and another fee is levied every hour at a decreasing rate), the variables of income made and hours worked would have a nonlinear relationship. In this instance, the correlation coefficient is likely to be closer to zero than one or negative one.
When interpreting the value of the correlation coefficient one needs to remember that correlations can be found between many different variables, yet the relationships between the variables may not have anything to do with the variables under consideration. They may instead both be tied to some as yet unknown variable. As an example, sales of air-conditioners and drownings in swimming pools both go up during the summer months. However, it would be unwise to conclude from this that buying an air-conditioner makes you more likely to drown in a pool. Rather, during the summer the weather is hotter, and people are more likely to buy air-conditioners and spend more time in pools (becoming more likely to drown in pools as well).
Remember that the correlation coefficient cannot prove a cause-and-effect relationship. A correlation coefficient may only provide evidence that the two variables are related, it can’t tell us if one of the variables causes another variable to change.
Establishing Causation
People often believe that when there is a correlation between two different variables, there must be a causal relationship between the two variables. While a correlation cannot prove causation, properly designed studies can help tease out causality from relationships between variables. This is done by controlling the studies for outside variables. Controlled studies are those that try to eliminate or account for the influence of outside variables that are not the target variables of the study. For example, test populations are frequently split into two or more groups, with the groups being identical (in theory). Despite being nearly identical in all relevant criteria, the groups will receive a different treatment. The outcomes of the different test groups are monitored and compared against one another. If the different test groups have different outcomes after the experimental phase of the study, the different test features may have influenced the outcome of the experiment.
More On Correlation And Causation

Photo: mohamed_hassan via Pixabay, CC0
The assumption that one event causes another simply because they are correlated with each other is a logical fallacy. However, in an attempt to avoid this fallacy sometimes people go to the opposite extreme and assert that correlation is never evidence of causation or that it never implies causation. This isn’t true and if this were true, a great portion of the evidence derived from scientific research would be invalid.
One example of asserting that correlation doesn’t imply causation is when tobacco companies argue that smoking it doesn’t cause lung cancer, merely that there is a correlation between lung cancer and smoking. It is true that the mere correlation between the two events (smoking and getting lung cancer) isn’t enough to prove causation, but correlation does suggest a causal relationship may exist and the more research is done on the issue, the more plausible it becomes a causal relationship exists. In this case, there are multiple different correlations that imply smoking leads to lung cancer, and this is combined with an assessment of biological plausibility to let causation be a reasonable assumption.
Correlations should be placed into the proper perspective, reviewed with the correct analytical lens depending on the type of study being done. For instance, there are at least two ways one can get correlational data: Experimental studies and observational studies.
Experimental studies have researchers intervening in the conditions of observation, like giving experimental medicine to a study population. In these experimental studies, researchers try to isolate the variable of interest to the study and control for the impact of other variables. The more variables accounted for and controlled for, the more likely there is to be a cause-and-effect relationship between the variables of interest. Think of how placebo pills are often assigned to members of the test group while other test subjects get the active treatment. The placebo is designed to control for the possibility of outside factors influencing the state of the test subjects, so when placebos are used the results of the study are usually considered to be evidence of causation – evidence the experimental drug worked.
Observational studies are where data is merely collected through observations of the world, with no intervention in the setting under observation. Observational studies are useful because it is easier to examine large numbers of subjects when compared to an experimental study. The drawback of observational studies is that it is more difficult to control for variables which could influence the correlations that are witnessed.
When an observational study finds a lack of correlation, it is easy to assume there is no causation between the variables X and Y, unless a correlation exists between factors unaccounted for. When observational studies produce evidence of correlations between variables more thorough analysis of the correlation should be conducted before cause-and-effect is assumed. Without this more thorough analysis, it is difficult to know if a correlation between X and Y suggests X causes Y, Y causes X, X and Y are both influenced by a different variable, or if the correlation is simply a coincidence and not evidence of an effect worth studying.
Related Posts
 Improving Tools For Quality Improvement: Crossings, Runs, And Crossrun
 Coherent Poly Propagation Materials With 3-Dimensional Photonic Control Over Visible Light
 Reconstructing Commuter Networks Using Machine Learning And Urban Indicators
 Surprising Internal Structure Of Whole Wheat-Green Gram Functional Bread
 Tailoring Tomatoes To Match Individual Consumer Needs
 Eavesdropping On “Classroom Talk” In Undergraduate STEM Classrooms