


Almost all calculations involving solar radiation on the earth’s surface are currently carried out with integrated radiation values, such as hourly values obtained from ground-based measurements or satellite observations. Although it has been noted that using such radiation averages ignores much of the intermittency induced by clouds (Suehrcke & McCormick, 1988), the hourly calculation approach continues to be used, including for performance prediction of photovoltaic (PV) systems.
McCormick & Suehrcke (2018) point out that the use of integrated data (e.g. hourly) hides the variability of both the solar radiation and load in PV system calculations. Figure 1 shows a plot of one-minute and hourly solar radiation for a partly cloudy day from Geraldton, Australia. From the figure, it is readily apparent that fluctuations seen on a one-minute time scale are absent in the hourly data because the frequency of the intermittent radiation is too high to be detectable in hourly average values.
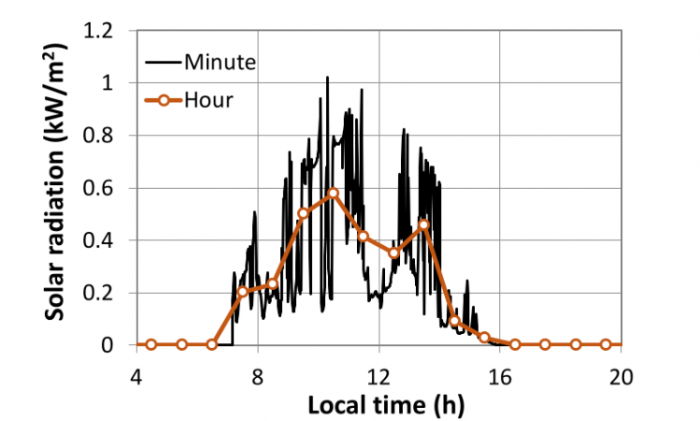
Fig. 1. One-minute and hourly solar radiation incident on a PV array tilted 20o towards the equator for 30 May 2013, Geraldton, Australia (McCormick & Suehrcke, 2018). Republished with permission from Elsevier from: https://doi.org/10.1016/j.solener.2018.06.043
In past calculations, where the total energy delivered by a PV array was the main interest, the use of average solar radiation has generally yielded satisfactory results. This can be understood from the fact that the output from a PV array almost rises linearly with the solar radiation input when the PV array is operated at the maximum power point. However, with the increasing use of battery storage in PV systems and the variability affecting the electricity network, the use of average radiation and load values in calculation may no longer be appropriate.
One issue raised in the study of McCormick & Suehrcke, 2018, is the effect the solar radiation (and load) variability has on the lifetime of PV system batteries, in particular, lithium-ion batteries. Currently, the degradation of most solar batteries is tested using a standard cycle, where the battery is repeatedly fully discharged and charged. The number of cycles required for the battery capacity to degrade by a certain percentage (e.g. 20%) is then used to estimate the battery lifetime by relating the number of cycles to the number of diurnal cycles or the aggregate energy discharge throughput.
The standard test cycle relates well to the operation solar batteries experience during a clear day but has no relation to the battery operation during a partly cloudy day, such as the one shown in Fig. 1. The simulations from the McCormick & Suehrcke (2018) suggest that battery currents may not only be much more variable during partly cloudy days than predicted by simulations with hourly data, but battery currents may also have larger magnitude and can undergo frequent reversals when a load is present (see also Fig. 2). Moreover, the energy transfer in and out of the battery during a partly cloudy day may represent up to two full battery charge and discharge cycles. There is a need for a test protocol that more realistically represents the operating conditions of batteries in solar systems.
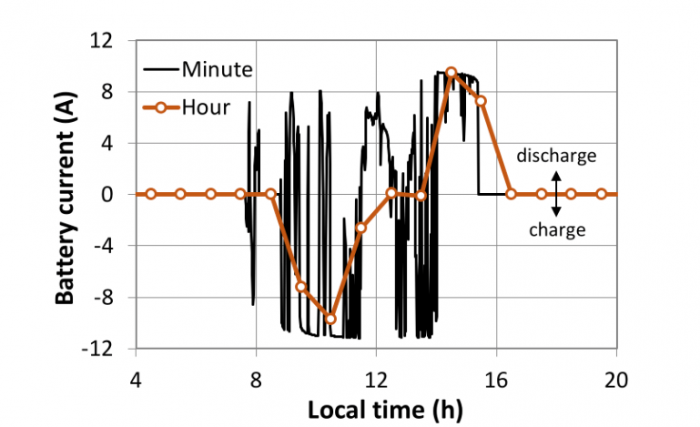
Fig. 2. Minute and hourly battery currents with a 10 kW PV array, 3 kW load and 4 kWh battery for 30 May 2013, Geraldton, Australia (McCormick & Suehrcke, 2018). Republished with permission from Elsevier from: https://doi.org/10.1016/j.solener.2018.06.043
When the battery is small relative to the PV array size, the PV system simulations with minute and hour input data also suggest solar batteries are sometimes charged more slowly with minute rather than hourly data (Fig. 3 provides an example for the day examined in Figs. 1 and 2). This perhaps surprising result can be understood from the maximum charge current a battery can accept (usually expressed in terms of the maximum C-rate). For a battery capacity that is small relative to the size of the PV array, the fluctuating minute current can frequently exceed the maximum battery current, which means some of the energy available from the PV array cannot be stored. For the average hourly battery current on the other hand, which smoothens the ups and downs, the average current may not reach the maximum battery current, thereby incorrectly predicting all PV energy collected is stored. This latter issue is may be important for predicting energy security from solar batteries.
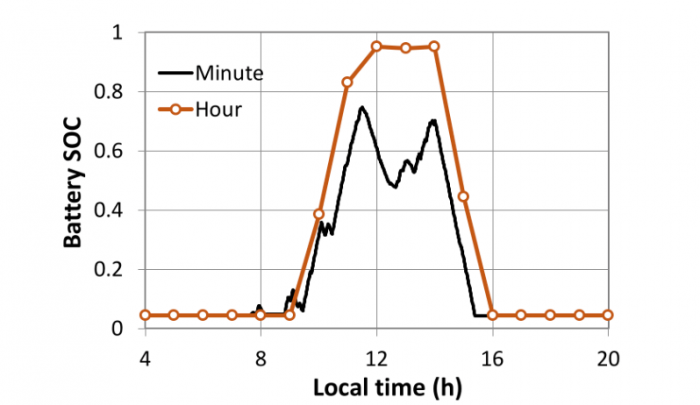
Fig. 3. Simulated SOC using minute and hourly radiation data for 30 August 2013, Geraldton, Australia (10 kW PV array, 3 kW load, and 4 kWh battery with 0.5 C maximum charge current, McCormick & Suehrcke, 2018). Republished with permission from Elsevier from: https://doi.org/10.1016/j.solener.2018.06.043
The findings are described in the article entitled The Effect of Intermittent Solar Radiation on the Performance of PV Systems, recently published in the journal Solar Energy. This work was conducted by Paul G. McCormick and Harry Suehrcke from SolarSim Pty Ltd, University of Western Australia, and James Cook University.
Reference:
- Suehrcke, Harry and McCormick, Paul G. “The frequency distribution of instantaneous insolation values.” Vol. 40, pp. 413-422, 1988.
Related Posts
 Duck-Billed Dinosaurs Uncovered In Aniakchak, Alaska
 Cryptic Diversity In Vietnam’s Limestone Karst Habitats
 An Improved Method To Remove Debris From Cyst Nematode Egg Suspensions And Computer-Aided Technologies For Egg Counting
 The Footprints Of Urbanization, Industrialization, And Agriculture On River Beds: Heavy Metal Contamination Assessment And Source Identification In River Sediments In Eastern China
 Aging Dolphins Via Pectoral Flipper Radiography
 Glycoalkaloids In Potatoes: The Effect Of Biostimulants And Herbicides