


The ionic radius of an atom is a measurement of the atom’s ion when the atom is within a crystal lattice. The ionic radius is defined as half the distance between two different atoms that are just barely touching.
The ionic radius trend refers to how the ionic radius of elements follows a predictable trend across the periodic table of the elements. Ionic radius tends to increase as you move from top to bottom down the periodic table, and it tends to decrease as you move left to right across the periodic table.
Defining Ionic Radius
As mentioned, the ionic radius of an ion is measured when the atom is in a crystal lattice. The value of the ionic radius is half the distance between two ions which are just barely touching one another. An electron shell’s boundary is difficult to get an exact reading on, so the ions of an atom are typically treated as if they were solid spheres. The ionic radius can easily be a little smaller or larger than the atomic radius, which is the radius a neutral atom of the element possesses.
“A physicist is just an atom’s way of looking at itself.” — Niels Bohr
Whether it is larger or smaller depends on the kind of electric charge the ion has. Cations, or positively charged ions, are usually smaller than a neutral atom of the element would be. This is because a cation has an electron removed from its shell, so the electrons which remain experience a greater attraction to the nucleus and are drawn towards it. In contrast, anions (negatively charged ions) have an additional electron. This electron increases the overall size of the electron cloud and can make the ionic radius bigger.
It’s difficult to get the exact measurement of the ionic radius because they can fluctuate depending on the method used to determine the ion’s size. Ionic radius is often measured with x-ray crystallography or with similar devices and systems, and implementing a different measurement system can change the measured value of the ionic radius. That said, most measurements of ionic radius fall between 30 pm to 200 pm.

The atomic radii of various elements as cations (red), anions (blue), and neutral atoms. The atomic radii have been listed in picometers. Photo: Popnose via Wikimedia Commons, CC-BY-SA 3.0
Take note that both the ionic radius and atomic radius aren’t fixed values. They can change because the various configurations of ions and atoms can influence the distance between the nuclei of the ions. The electron shells of two different atoms are capable of overlapping with one another, and different circumstances can shift off the distance by which they overlap.
The atomic radius of two atoms that are barely touching is sometimes referred to as the van der Waals radius. This is because of the way that the week attraction of the van der Waals forces influences the distances of the two different atoms. The noble gas elements are frequently reported with the van der Waals radius. The covalent bonding of metals to one another inside of a lattice means that the atomic radius may also be referred to as the metallic radius or covalent radius. Sometimes the distance between nonmetallic elements will even be referred to as the covalent radius.
The atomic radius that’s often given on charts is frequently a mixture of the values for van der Waals radii, covalent radii, and metallic radii. There’s only a small difference in these values and for the most part, the differences aren’t of any concern.
The Ionic Radius Trend
The ionic radius trend describes the predictable pattern that the ionic radius follows as you move across the periodic table. As you follow the periodic table from top to bottom down a group of elements (a column) the ionic radius increases for the next element. This happens because elements further down the periodic table have more electron shells, which increases the base size of the atom. Every higher principal energy level has orbitals that are bigger than the orbitals found in the smaller energy levels. The increase in principle energy levels outweighs the increased nuclear charge of the atom, hence the atomic radius increases.
“There are as many atoms in a single molecule of your DNA as there are stars in the typical galaxy. We are, each of us, a little universe.” — Neil Degrasse Tyson
If you follow the periodic table from left to right across a specific element period (or row), you will find that the ionic radius of the elements decreases. This may initially seem counterintuitive because the size of the atomic nucleus increases with larger atomic numbers. Yet this occurs because as the size of the atomic nucleus increases so does the amount of positive force that has an effect on the atom’s electrons. This means that as the size of the nucleus increases, the electrons of the atom are drawn in more tightly. The electrons within the atom are gradually pulled closer to the nucleus of the atom because of the atom’s increased positive charge. Note that there are some exceptions to this trend. For example, oxygen’s radius is actually a little larger than nitrogen’s radius.
This effect is extremely notable with the metal elements, as they and up forming cations. The atoms shed their outermost electron, and sometimes an entire electron shell is dropped from the atom. Despite this, the ionic radius of transition metals within a given period doesn’t fluctuate much from atom to atom near the start of a series.
Examples Of The Ionic Radius Trend
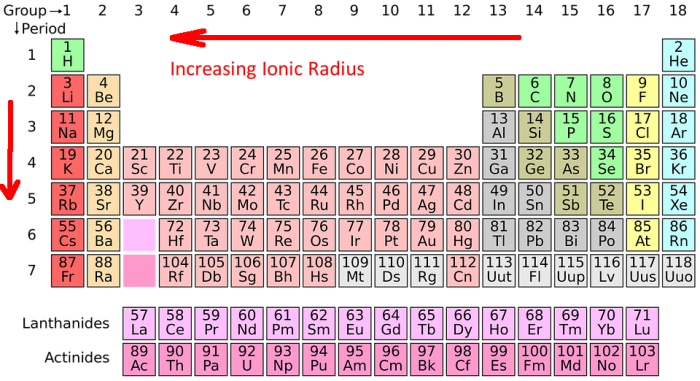
Photo: Geralt via Pixabay, CC0
Let’s take a look at some examples of the ionic radius trend. Let’s examine the elements in Group 1 of the periodic table.
- Lithium: Atomic Radius – 1.34
Sodium: Atomic Radius – 1.54
Potassium: Atomic Radius – 1.96
Rubidium: Atomic Radius – 2.11
Cesium: Atomic Radius – 2.25
Now let’s look at some of the elements within Group 17 of the periodic table:
- Fluorine: Atomic Radius – 0.72
Chlorine: Atomic Radius – 0.99
Bromine: Atomic Radius – 1.14
Iodine: Atomic Radius – 1.33
Other Trends In The Periodic Table
The atomic radius trend reflects the change in the atomic radius that occurs as you follow the periodic table from top to bottom. The atomic radius of the different elements tends to increase as you move down the periodic table much as the ionic radius does. The electronegativity trend describes how as one follows the periodic table left to right electronegativity tends to increase while in trends downwards as you move from top to bottom.
The electron affinity trend refers to how the electron affinity of elements tends to increase as you go from left to right across the periodic table and how it generally decreases as you move from the top of the table to the bottom. The ionization energy trend refers to how the amount of energy needed to displace an electron from an atom can be tracked using the periodic table. As you follow the periodic table from top to bottom, ionization energy typically decreases while it increases as you move left to right.
Related Posts
 Be Careful When Speaking About Lead Pollution: The Good, The Bad, And The Ugly!
 Temperature Has A Significant Influence On The Production Of SMP-Based Dissolved Organic Nitrogen (DON) During Biological Processes
 Does The Arrow Of Time Apply To Quantum Systems?
 Labeled Periodic Table
 A “Twist” In Wavefunction With Ultrafast Vortex Electron Beams
 Chemical And Biological Characterization Spot The Faith Of Nanoparticles