


A zero slope line is a straight, perfectly flat line running along the horizontal axis of a Cartesian plane. The equation for a zero slope line is one where the X value may vary but the Y value will always be constant. An equation for a zero slope line will be y = b, where the line’s slope is 0 (m = 0).
If one had an equation where the Y was 2.5, there would be a straight line running across the Cartesian plane horizontally at 2.5 on the X-axis. Let’s take a closer look at the zero slope line and discover why, no matter how much one may increase the X value, the Y value will not increase.
“Mankind invented a system to cope with the fact that we are so intrinsically lousy at manipulating numbers. It’s called a graph.” — Charlie Manger
The Equation Of The Slope Of A Line
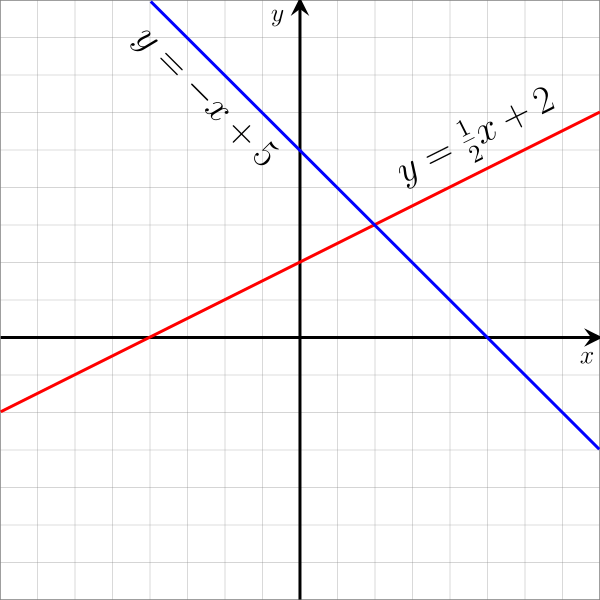
Let’s take a moment to understand what the slope of a line is. The slope of a line is a number that describes the change in position a line undergoes between two different points on a Cartesian plane. The slope of a line can be said to describe the “steepness” of the line, and the slope is typically represented by the letter “m.” Remember that slope is part of a linear equation, and the linear equation reveals both how steep a line is and which direction the line moves in.
“We call the slope of the line m because the word ‘slope’ begins with the letter m.” — Howard Whitley Eves
Lines that have a positive slope move right and up on a graph while negatively sloped lines will move to the right and down. While many lines have these positive or negative slope attributes, some lines have zero or no slope.
Example of lines with rise and run, or changes in vertical and horizontal position. Photo: Jim.belk via Wikimedia Commons, CC0
When you know two different points on a line you can find the slope of a line. The general equation for the slope of a line is the change in Y over the change of X. You can also represent this as Y – Y1/X – X1. Therefore, you could say the equation for M – the slope of a line – when given two different points is:
M = Y – Y1/X – X1
Or you could say that M is just the Change in Y/Change in X.
Defining A Zero Line Slope
The slope of a line is the rise of the line over the run of the line. The rise is how much the line travels up or down on as it moves from one point to another on a graph, while the run of a line is how much it travels right or left between the same given points on the graph. However, if the line isn’t moving up or down at all as it moves between the two points, this means that the slope of the line is zero, or zero divided by the run of the line. Since zero divided by a number will always be zero, this means that the slope of the line itself will always be zero. Since the line has no slope at all in this instance, it will appear as a straight, horizontal line moving from left to right, no matter how far it moves left or right.
The Graph Of A Zero-Slope Line
Zero-slope lines are very easy to graph on a Cartesian plane given that they have no vertical movement. Just take the standard linear equation (Y = mx + B) and drop off the X since there is no movement on the X-axis. This means that the equation is Y = 0X + b, or just Y = b once you’ve eliminated the X (since anything multiplied by zero is always zero). An equation like Y = b means that the line is only defined by the point where it intercepts the Y-axis. To plot this line, just pick out the Y-intercept (b in y=mx+b) and draw a straight, horizontal line across the X-axis. You just need to ensure that the horizontal line is crossing the Y-axis at the right y-coordinate and the rest is simple.
Here’s an example:
- If you have a line with the equation Y = 0x + 4, you can simplify this to just y = 4. To graph this equation out, begin by drawing the y-intercept at (0,4) and create a horizontal line running across the entire graph from that point. This represents a zero slope line that ends up crossing the Y-axis at point (0, 4).
One more example:
- If you have a line with the equation Y = 0x + 7, you can simplify this to just y = 7. You can graph this by plotting the y-intercept at 7 and drawing a horizontal line through that point. This is representative of a zero slope line that ends up crossing the Y-axis at point (0, 7).
Infinite Slopes?
Much like lines that possess zero slope, there are also lines that are “infinite” in nature or “undefined.” Infinite/undefined lines don’t even cross the Y-axis. Instead, an infinite/undefined line will always stay parallel to the Y-axis into infinity/along the entire length of the line, crossing the X-axis at a single point. They are the conceptual opposite to zero-slope lines, having no “run” instead of no “rise”, meaning there is no horizontal/left travel of the line. The reason these lines are called undefined is that a line must have a definable slope, but this isn’t possible with infinite vertical lines. Trying to enter the line into the slope equation results in a slope being divided by zero, and since it is impossible to divide by zero, the line is undefined.
“There is no slope problem.” — Charles Johnson
How To Graph An Undefined Slope Line
Example of an undefined line. Photo: By IkamusumeFan – Own work, CC BY-SA 4.0, https://commons.wikimedia.org/w/index.php?curid=41768049
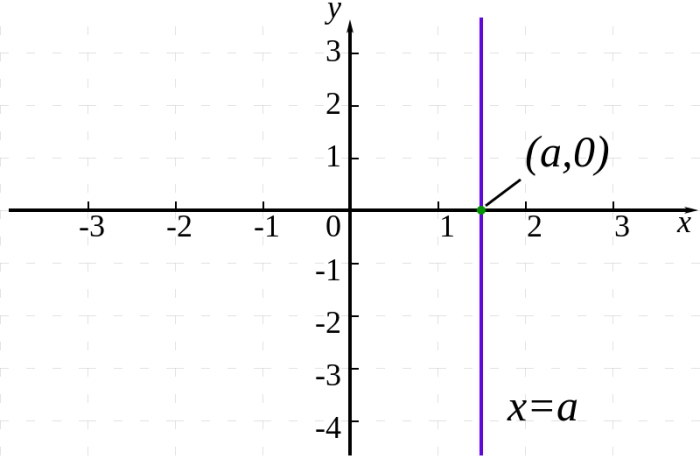
Though “undefined” lines are undefined in the slope sense, you can graph them. A line that has undefined slope just travels straight up and down on the Cartesian plane, remaining parallel to the Y-axis at all times. Therefore, graphing this line is as simple as finding the point at which the line crosses the X-axis and drawing a straight vertical line through it, you don’t need to worry about the y-intercept at all.
If we alter one of the previous examples of zero slope lines, we can see what the equation for an undefined line would look like. Instead of y = 0x + 7 or y = 7, let’s invert this so that X = 7 instead. Thus the intercept point would be (7, 0), and the graph would be of a vertical line that crosses through the X-axis at point 7, constantly remaining parallel to the Y-axis.
Related Posts
 Be Careful When Speaking About Lead Pollution: The Good, The Bad, And The Ugly!
 Temperature Has A Significant Influence On The Production Of SMP-Based Dissolved Organic Nitrogen (DON) During Biological Processes
 Does The Arrow Of Time Apply To Quantum Systems?
 Labeled Periodic Table
 A “Twist” In Wavefunction With Ultrafast Vortex Electron Beams
 Chemical And Biological Characterization Spot The Faith Of Nanoparticles