


When people think about measurable variables, such as height and age, it is frequently assumed that they can be represented on the real line. For such variables, it is easy to obtain a measure of the average that is defined as the sum of the values divided by the number of values.
It is also possible to quantify how much the measurements are scattered (or grouped) around the average value. This is usually taken to be the standard deviation, a quantity which is proportional to the square root of the sum of the differences of the values from their average squared – the square is necessary, otherwise, contributions from values larger than the mean cancel out with those smaller than the mean. The mathematics associated with this type of variables would appear rather simple. However, this does not apply to all types of measurable variables.
It turns out that there are variables that cannot be mapped on the real line because restart from zero at some point, i.e. they are periodic. One common example is the direction defined as the angle subtended, for example, with the North. Angles take values between 0 and 360 degrees. Once we go beyond 360 degrees we restart from zero again. Thus, for example, 361 degrees is equivalent to 1 degree. This phenomenon makes the mathematics of such variables much more complicated. The notion of large and small does not apply anymore since the mere shifting of the position of the zero will change the relative values. As a matter of fact, the zero direction itself is arbitrary – we are free to measure angles from the South or the West for example.
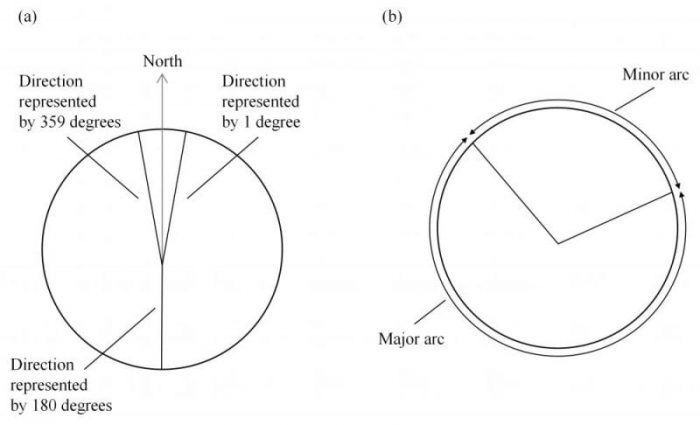
Figure 1. (a) The direction of two angles representing 1 and 359 degrees and (b) the minor and major arcs subtended by two angles on a circle. Credit: Pierre S. Farrugia
These properties of directional variables make their statistics non-trivial. For example, the arithmetic average of 1 and 359 degrees is 180 degrees which point South (assuming the zero direction is with the North). However, both 1 and 359 degrees point toward the Northern direction as shown in Figure 1(a). It also follows from the figure, and is intuitively obvious, that the zero direction is the most appropriate measure of the average.
Subtraction is equally complicated. As indicated in Figure 1 (b), two angles subtend two arcs on a circle: a major and a minor. In these circumstances, the minor arc is conventionally used as a measure of the difference between two angles. Even so, a simple subtraction might not necessarily yield the minor arc. Taking for example 1 and 359 degrees, subtracting the two values gives 358 degrees, which corresponds to the major arc. The minor arc would be 2 degrees.
The research on directional variables has grown significantly in recent years to study not just values that lie on a circle but also other types of periodic variables such as days and years. One such application of directional statistics is found in the study of the wind. Even though the wind is a three-dimensional variable, for most practical purposes the vertical direction can be ignored so that the wind is treated as a circular variable. Measures of the average direction and angular standard deviation are used in pollution dispersion studies to determine the direction in which the pollutant from a source is carried by the wind and the angular width over which it is dispersed.
The effect of the wind on pollution dispersion is however not dependent solely on its direction but also on the magnitude (strength or speed). Wind is, in fact, a type of physical variable called a vector that has both magnitude as well as direction. Notwithstanding this, the effect of the wind speed has so far been side-lined when determining the average wind direction and standard deviation. This practice might not lead to appropriate representative statistics for the wind, as illustrated by the following example.
Consider a span of time during which there are a large number of random small, i.e. low speed, wind gusts in all directions and a couple of strong, i.e. high speed, wind gusts in the North direction. If we could observe what happens to an air parcel, the small wind gusts would shift the air parcel in different directions with the net effect being that it remains in the same place. It is only the strong wind gusts that will effectively change the position of the air parcel. Thus, the average direction of motion for the air parcel in this period is the North direction. However, ignoring the wind speeds, and applying the conventional circular statistics can lead to a direction which is different from the North. The actual value will be dependent on how uniformly distributed are the small wind gusts.
Similar considerations apply to the measure of dispersion of the angles. Given that the only significant motion of the air parcel is in the North direction, there is no dispersion. However, once again we observe that the application of the conventional circular statistics will yield a large value, typically close to the standard deviation of uniformly distributed angles.
While the above example appears to be a rather extreme case, examination of field measurements showed that such situations can arise in practice. This indicates that the current directional statistics do not provide physically correct descriptive measures for vector variables. On this premise, new descriptive statistics for the measure of the direction and the dispersion were derived. Adequate statistics were obtained in which the contribution of each angle was weighted (multiplied by) the wind magnitude. Comparison of the different computing algorithms using measured data showed that the new vectorial statistics performed well and were more consistent than their circular statistics counterpart.
What can be considered to be a bit surprising is the reason why directional statistics provide reasonable measures of average direction and dispersion, at least in the case of the wind. A follow-up investigation showed that, for the data being considered, there appears to be a relation between the occurrence of an angle and the wind speed. For most situations, these two quantities appear to be proportional. Such a result can be expected from a physical perspective. Basically, one would expect that the stronger the wind is in one direction, the more it is expected to persist in that direction. This allowed circular statistics to be applied to the wind without there being a major noticeable difference from the expected result. It is only when there is no relation between direction and wind speed that the difference between the vectorial and circular statics emerges. However, for a proper representation, vectorial statistics that take into account both the direction, as well as the magnitude, should be used.
The work can be considered to be an initial investigation into the statistics of vector variables. Thus far, very view studies have been carried out. Yet, the results obtained would suggest that there is the possibility of creating a whole new branch of statistics dedicated to this type of variables. This could be applied to other physical variables and not just the wind. In fact, in physics there exist a significant number of other vectors, such as force, displacement and magnetic field strength, which could be analyzed using this type of statistics.
These findings are described in the article entitled Vectorial statistics for the standard deviation of wind direction, published in the journal Meteorology and Atmospheric Physics. This work was led by Pierre S. Farrugia and Alfred Micallef from the University of Malta.
Related Posts
 Improving Tools For Quality Improvement: Crossings, Runs, And Crossrun
 Coherent Poly Propagation Materials With 3-Dimensional Photonic Control Over Visible Light
 Reconstructing Commuter Networks Using Machine Learning And Urban Indicators
 Surprising Internal Structure Of Whole Wheat-Green Gram Functional Bread
 Tailoring Tomatoes To Match Individual Consumer Needs
 Eavesdropping On “Classroom Talk” In Undergraduate STEM Classrooms