


In a world of ever-increasing pressures on natural resources, water and energy issues are essential sustainability concerns.
A significant share of global water resources are used for energy production and overexploitation is seen in many regions affecting not just quantities but also contributes to degraded water quality and low sustainability.
At the same time, the demand for energy increases globally not least in the developing world, where population and economy growths are seen in conjunction with a shift and demand towards higher standards of living. Non-renewable energy sources typically use vast quantities of water, mainly related to the cooling of turbines, and while there is a focus on introducing renewable energy sources, many developing regions still depend on traditional water consuming technologies.
To understand the link between water and energy, often referred to as the water-energy nexus, to properly manage current conditions as well as proposing sustainable future energy- and environmental pathways, there as is a need for a thorough understanding of the water used for producing energy using a certain energy source and technology. This understanding requires data, which optimally would be at high temporal scales and depict quantities, sources, and sinks (extraction depth/river etc.), geographical location, and timing. However, this information, if present, is often hidden behind paywalls, oftentimes due to commercial interests or the quality is poor.
A new study by Morten A.D. Larsen and Martin Drews from the Technical University of Denmark published in Science of The Total Environment (Larsen and Drews, 2019) looks into the quality of present-day openly available data on the water-energy nexus at larger scales, here highlighted for Europe. The approach is to combine multiple (free) data sources to generate the best possible estimate on the actual 1980-2015 historical water consumption (net share) and withdrawal rates (total share including return flow) for EU28 countries and compare these estimates with reported numbers as available from Eurostat (European statistical office) (Eurostat, 2018). The data sources in the study included not only general data repositories but also elaborate satellite imagery analyses to assess the technologies employed as well as the water source in question (fresh or saline water), as such simple information is not sufficiently available through open access sources currently.
The methodology included firstly: I) A literature review on general water usage levels from all relevant energy sources and technologies; subsequently, II) an assessment on how these technologies are distributed on a country scale and how much freshwater they employ; and finally, III) combining these numbers with actual electricity generation statistics.
A key finding from the study is the resemblance between estimated water withdrawal levels and corresponding reported levels (from Eurostat) both historically (1980-2015) for EU28 (Fig. 1) and per country (2015) (Fig. 2), albeit at a yearly scale. Many of the inconsistencies which are still present between estimations and reported numbers can be explained by the nature of the data.
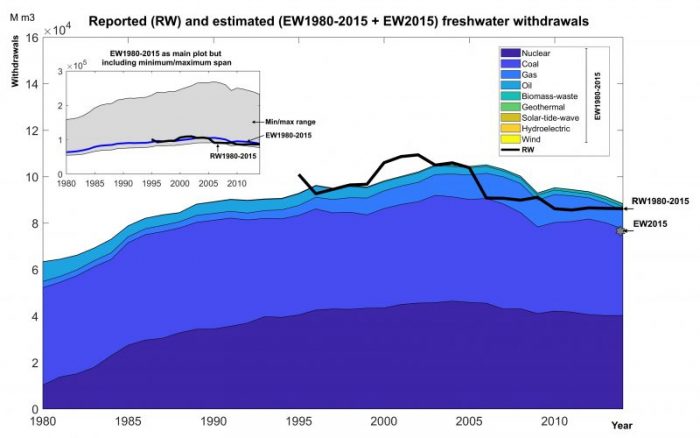
Figure 1. Main figure: reported (RW) and estimated freshwater withdrawals per energy source (EW1980-2015) (as well as the sum of estimated freshwater withdrawals per country (EW2015) (arrow)). Insert: EW1980-2015 calculated based on the minimum and maximum water-usage levels for each energy source, cooling technology, and RW. Republished with permission from Elsevier from www.sciencedirect.com/science/article/pii/S0048969718339184
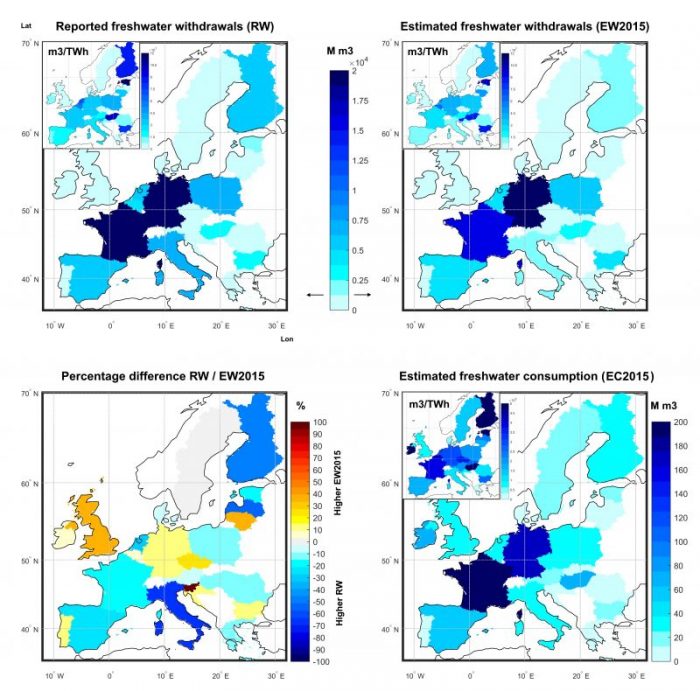
Figure 2. Freshwater withdrawals (EW and RW) and consumption (EC) for EU28 countries. Top left: reported freshwater withdrawals (RW2015). Top right: estimated freshwater withdrawals (EW2015). Bottom left: the difference between RW2015 and EW2015 (%). Bottom right: estimated freshwater consumption (EC2015). Inserts show levels from the main plots but per generated electricity amounts. Cyprus, Luxembourg, Malta, and Slovakia have no reported water withdrawals (white color). Republished with permission from Elsevier from www.sciencedirect.com/science/article/pii/S0048969718339184
A key message from the study is the lack of proper data. There is a substantial gap in water-energy nexus data with regards to availability, access, and quality to facilitate high-quality quantitative studies, and most energy data omit water linkages entirely. Such an effort to improve the water-energy nexus data should optimally be based on open access availability and should rely on the same forcings and conventions for optimal comparison grounds. A database along the lines of what is seen in, for example, climate research communities (e.g. CORDEX (Giorgi and Gutowski, 2015) and CMIP5 (Taylor et al., 2012) data repositories) is further urged.
A key perspective from the study is that the results, promising as they are, can already support interdependencies between water and energy within modeling efforts, where existing models are often refined to reflect new knowledge or specific challenges and research questions. This finding is much in line with current trends where issues within the water-energy nexus are being incorporated into energy modeling.
These findings are described in the journal entitled Water use in electricity generation for water-energy nexus analyses: The European case, recently published in the journal Science of the Total Environment. This work was conducted by Morten Andreas Dahl Larsen and Martin Drews from the Technical University of Denmark.
References:
- Eurostat, 2018. Eurostat Database [WWW Document]. URL https://ec.europa.eu/eurostat/web/energy/data (accessed 5.1.18).
- Giorgi, F., Gutowski, W.J., 2015. Regional Dynamical Downscaling and the CORDEX Initiative. Annu. Rev. Environ. Resour 40, 467–90. https://www.annualreviews.org/action/cookieAbsent
- Larsen, M.A.D., Drews, M., 2019. Water use in electricity generation for water-energy nexus analyses: The European case. Sci. Total Environ. 651, 2044–2058. https://linkinghub.elsevier.com/retrieve/pii/S0048969718339184
- Taylor, K.E., Stouffer, R.J., Meehl, G.A., 2012. An overview of CMIP5 and the experiment design. Bull. Am. Meteorol. Soc. https://journals.ametsoc.org/action/cookieAbsent
Related Posts
 Be Careful When Speaking About Lead Pollution: The Good, The Bad, And The Ugly!
 Temperature Has A Significant Influence On The Production Of SMP-Based Dissolved Organic Nitrogen (DON) During Biological Processes
 Does The Arrow Of Time Apply To Quantum Systems?
 Labeled Periodic Table
 A “Twist” In Wavefunction With Ultrafast Vortex Electron Beams
 Chemical And Biological Characterization Spot The Faith Of Nanoparticles