


Recording neuronal activity from outside
Our neurons communicate with each other chemically at their synapses and electrically within. Once a neuron gets “excited,” an action potential (spike) starts in its body and races along its axon (typically 1 µm thick, 10 cm long in the case of the eye) to contact at its end, typically a thousand colleagues via synapses.
The electrical activity within the neuron can be monitored from the outside, not just next to the neuron, but also from the surface of the body. This is well-known with respect to the electrocardiogram (ECG), which picks up electrical activity from the motor neurons and muscle cells in the heart, or the electroencephalogram (EEG), which picks up electrical activity from the neurons in our brain.
Less widely known are signals associated with our senses: somatosensory, auditory, or visually-evoked potentials. Here, the pertinent modality is stimulated via touch or tone, or, in the visual modality that interested us here, light-flashes or pattern changes are applied. This stimulation evokes a neural response with associated electrical activity.
A major problem to measure this is the ongoing brain and muscle activity, which swamps the small responses associated with vision. This problem is solved via a trick which became viable only after computers were set to the task, the so-called “time-synchronized averaging.” We know, to the millisecond, when light stimulation occurs, and the electrical eye- and brain responses typically appear regularly at a short and fixed delay after. In contrast, the on-going activity is, well, on-going and not related in a timely fashion to the stimulus. So we repeat the stimulation about a hundred times and average the signal, measured from the eye or from the brain, always in 100-ms-epochs after (and a little before) the stimulus. In the long run, ongoing activity “averages out” while the stimulus-related activity “builds up,” even if ten or a hundred times smaller than the unwanted signals.
In the work we are describing here, signals were measured from the eye with appropriate electrodes. No, we did not stick needles into our eyes or the eyes of our other participants. Rather, we used a tiny thread which swims on the eye. Initially, for some seconds, there is a foreign-body feeling, even if applied well, but that vanishes quickly. Thus, it is easy to look at a computer screen presenting complex visual patterns while the electrode picks up the evoked activity.
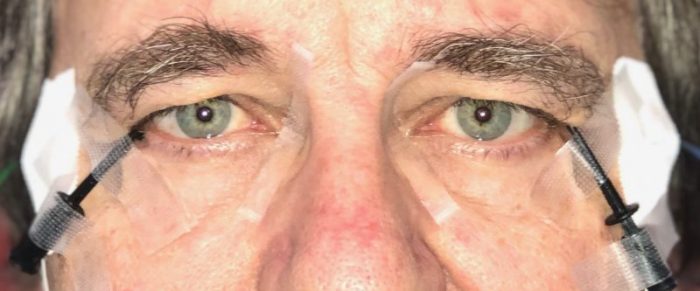
Photograph of the eyes of one of us with the thread electrodes placed on the eyes. Image courtesy Michael Bach
The pattern electroretinogram (PERG)
Our retina is a complicated place. There is a sequential chain of processing, starting with the photoreceptors that turn light into graded voltage change. This signal passes the “bipolar cells”, which in turn drive the relatively large retinal ganglion cells to create action potentials, which run in their axons along the retina until leaving the eye at the optic disk to form the optic nerve. The optic disk is also termed the “blind spot” (Bach 2018)because of the density of axon fibers there simply isn’t enough space for photoreceptors.
All of the cells in the retina are interesting, not least because of their role in various eye diseases, and we can list to the activity of many of them. The overarching term here is “electroretinogram”, which means a recording of electrical changes from the retina. By applying the electrode at the right place, using the right kind of stimuli (light flashes or pattern changes or whatever) and looking at the right time in the response one can follow processing (or diseased lack thereof) from layer to layer. We will here zoom in on the “pattern electroretinogram” (PERG). This is evoked by pattern stimulation, such as a checkerboard, where several times per second the bright and dark parts interchange (“pattern reversal”). The net amount of light entering the eye stays constant, all that changes is the pattern. The electrical response to this kind of stimulus was found to be generated by the retinal ganglion cells. How do we know that? A number of different findings come together here are:
- Sticking a needle electrode into an animal’s retina can reveal where the response is largest
- silencing specific transmission pathways by applying specific pharmacological agents to the retina can abolish the response and
- studying the effect of specific eye diseases can show their effects on the response.
The PERG has two major excursions (or components) called P50 and N95. The names combine the electrical polarity (P for positive, N for negative), and the time (rounded, in milliseconds) where they are largest – time zero being the instant of pattern reversal.
Ok, P50, N95, whatever, why should I care? Well, there are some eye diseases which could profit from earlier detection. As a case in point, take glaucoma. Glaucoma is a leading cause of blindness worldwide, with a prevalence of 4% in the population at 40–80 years of age. The disease begins with damage to the head of the optic nerve from impaired retrograde transport of neurotrophic messengers. This can happen from elevated pressure in the eye or from impaired blood supply there. Then the retinal ganglion cells think, “No one’s listening to us anymore” and decide to commit suicide, making the damage irreversible.
Because there exist treatments for glaucoma, early detection of the disease is of great value. Measuring the intraocular pressure assesses just one risk factor since there is also “low-pressure glaucoma” and many eyes tolerate increased pressure over decades. This calls for a functional measure that would reveal an early functional impairment of the ganglion cell. Indeed, here the pattern ERG begins to shine because it actually provides the desired function (Bach and Hoffmann 2008). Let this be enough motivation to explore the pattern ERG, there are other (rarer) but even more specific diseases needing a functional ganglion cell marker, even in clinical depression (Bubl et al. 2010, 2012)but not in ADHD (Bubl et al. 2013).
So we want to learn more about the PERG, more about P50 versus N95. In some diseases, they are affected likewise, in others differentially. As a common feature: when the ganglion cells have atrophied, both are largely gone. Motivated by another retinal measure, the optic nerve head response (Sutter and Bearse 1999), we began to wonder: where, exactly, are P50 and N95 generated? Really at the same place? After all, the ganglion cells are about 10 cm long, most of which are the axons. There was already evidence that the P50 is generated within the ganglion cell dendrites, thus very close to the cell body (Bach and Hoffmann 2006). But the N95? That clearly was associated with spikes, but from the cell body or along the axon?
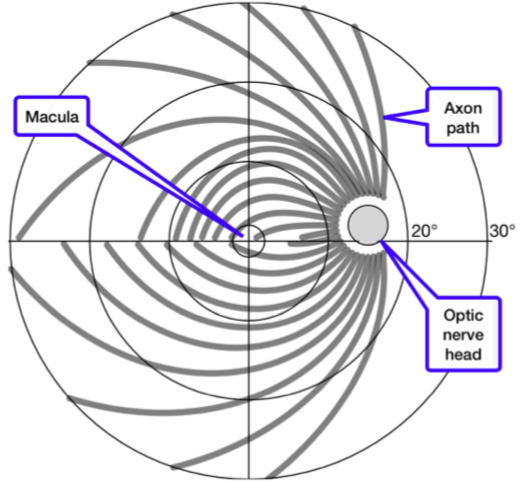
Axon fiber paths (gray) on the retina. In the center is the macula, the area of sharpest vision. The large circles represent distances from the center of 5°, 10°, 20°, and 30°. The gray disk at 16° represents the optic nerve head where the axons leave the eye. This is also known as the “blind spot” (Bach 2018)since there is no room for photoreceptors. Obviously, axon path lengths varies widely across the retina. (Image courtesy Michael Bach)
How time can reveal the source of activity
Timing can reveal the source of electrical activity via the finite conduction velocity. Although electricity itself travels at the speed of light, a pulse along an axon travels 9 orders of magnitude slower (Wikipedia 2018): The membrane of the axon changes locally, switching on and off ion channels for various types of ions, thus producing a voltage change. This excites the neighboring membrane to do the same.
Thus, the conduction speed of fibers without insulation (myelin, which would enable the much faster “saltatory conduction”) is between 0.5 and 3 m/s. With this velocity the time for the pulse from a retinal ganglion cell body to the entry of the optic nerve head (leaving the eye) is some milliseconds, depending on the axon length along the retina. And this length depends on the position of the ganglion cell on the retina, varying from 0 to ≈10 mm, amounting to a time difference of 10 ms or so. Such a time difference is easily measured.
Our specific findings
We used a relatively rarely employed technique, the multifocal PERG. This allows stimulating local retinal patches selectively with a pattern reversal, thus evoking a local PERG. We stimulated 36 of those patches quasi-simultaneously. Since the local pattern reversals have an orthogonal time sequence, one can separate out the local responses although only recording with a single fiber electrode on the surface of the eye.
Thus, we had 36 little PERGs, allowing us to measure 36 local P50 and N95 peak times averaged over 21 visually normal participants. We investigated how the peak times depend on the length of the axon from the cell body to the optic nerve head, specifically the time difference N95–P50. We hypothesized (1) the P50 originates in the ganglion cell bodies, and (2) the N95 originates not from the cell body itself, but from some point along the axon. If so, this time difference should systematically depend on axon length. Initially, the results were disappointing: there was some distance effect, but also a wide scatter.
Then we realized, that two factors are at work: the conduction velocity of the fibers varies from the retinal center to the periphery in a systematic way (Sinha et al. 2017)from 0.5 m/s near the center to 3 m/s at 25° eccentricity. When we considered the two factors, eccentricity (distance from the center) and axon length (from cell body to optic nerve head) we could explain over 80% of the peak-time variance.
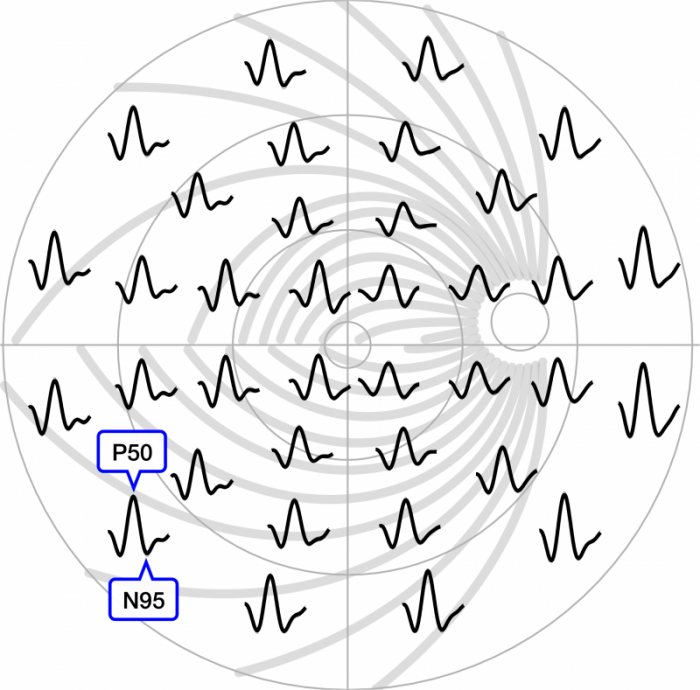
36 local PERGs across the central ±30° of the retina. For one PERG the P50 peaks and N95 troughs are indicated. The PERGs are placed at the position where the local pattern reversal stimulus was projected. In the background, the nerve fibers from the previous figure are seen.
The time delay between P50 and N95 (not visible at this resolution) varies depending on axon length and suggests that the N95 is actually generated at the optic nerve head. (Image courtesy Michael Bach)
What does this mean?
Scientific findings never really prove anything, rather they make a hypothesis more probable (or not, as the case may be). Therefore, it is often better if competing research groups also attack the same problem. With these caveats, our findings (with more detail than explained above) suggest the following interpretation: The N95 peak does not originate at the cell body, but in all likelihood at the point of axon entry into the optic nerve head. The “kink” in the axons there changes the electric field distribution from the local currents in a characteristic way, leading to the N95.
Furthermore, this suggests (and supports previous interpretations, (Bach and Hoffmann 2006)) that the N95 reveals spiking activity, thus revealing functional integrity of the retinal ganglion cells. These ganglion cells represent an important stage in our visual perception of the world, from the photoreceptors to vision centers in the brain.
With this understanding, we can advance the interpretation of the Pattern Electroretinogram, be it for rare ophthalmological diseases, the (unfortunately) more common glaucoma, or the interesting nascent applications in psychiatry.
These findings are described in the article entitled Retinal conduction speed analysis reveals different origins of the P50 and N95 components of the (multifocal) pattern electroretinogram, recently published in the journal Experimental Eye Research. This work was conducted by Michael Bach from the University of Freiburg, Anne-Kathrin Cuno from the University of Magdeburg, and Michael B. Hoffmann from the University of Magdeburg and Center for Behavioral Brain Sciences.
References:
- Bach M (2018) Blind spot demonstration. https://michaelbach.de/ot/cog-blindSpot/index.html. Accessed 20 Dec 2018
- Bach M, Hoffmann MB (2008) Update on the pattern electroretinogram in glaucoma. Optom Vis Sci 85:386–95
- Bach M, Hoffmann MB (2006) The Origin of the Pattern Electroretinogram (PERG). In: Heckenlively J, Arden G (eds) Principles and Practice of Clinical Electrophysiology of Vision. MIT Press, Cambridge, London, pp 185–196
- Bubl E, Dörr M, Philipsen A, et al (2013) Retinal contrast transfer functions in adults with and without ADHD. PLoS ONE 8:e61728. doi: 10.1371/journal.pone.0061728
- Bubl E, Ebert D, Kern E, et al (2012) Effect of antidepressive therapy on retinal contrast processing in depressive disorder. Br J Psychiatry 201:151–158. doi: 10.1192/bjp.bp.111.100560
- Bubl E, Kern E, Ebert D, et al (2010) Seeing gray when feeling blue? Depression can be measured in the eye of the diseased. Biol Psychiatry 68:205–208. doi: 10.1016/j.biopsych.2010.02.009
- Sinha R, Hoon M, Baudin J, et al (2017) Cellular and Circuit Mechanisms Shaping the Perceptual Properties of the Primate Fovea. Cell 168:413-426.e12. doi: 10.1016/j.cell.2017.01.005
- Sutter EE, Bearse MA (1999) The optic nerve head component of the human ERG. Vision Research 39:419–436
- Wikipedia (2018) Nerve conduction velocity. Wikipedia
Related Posts
 Important Strategies To Help Healthcare Providers Support Patients With Diabetes
 Studying The Link Between Increased BMI And Late-Onset Preeclampsia In Pregnant Women
 A Bacterial Cell Imaging Method Using CRISPR And Microfluidics
 B. infantis Reduces Key Markers Of Intestinal Inflammation In Infants
 Epigenetic Changes In Multiple Sclerosis – Studied In Twins
 Did You Know Math Can Help Us Learn How Diseases Work?