
The urgency of climate change mitigation demands tools for examining how economies can embark – and stay – on a path of low-carbon transition. In times of war, economies become a “war machine,” configured to support their fighting forces while maintaining basic living standards at home. The conundrum of our times of peace in most countries is, “Can we afford to go low carbon?”
Plausible pathways must comply with physical (and technological) limits. They should be accessible to politicians and civil society alike for exploring options to understand the consequences, balance trade-offs, and optimize efficiency. By necessity, such pathways must encompass economic factors and physical constraints, and not be modeled with the price of energy as the main variable. This means bridging the thinking of economists and engineers, yet we observe a yawning gap. This problem has never been more important. The Nationally Determine Contributions introduced in the Paris Agreement of 2015 have a direct effect on each nation’s economy.
Why a new approach is needed
Economic modeling for energy systems mostly uses neo-classical economic assumptions such as perfect foresight and unlimited material substitutability. Accordingly, the modeler need not know anything about goods and services traded, only prices. While this might represent the market for a few products within a larger system, the whole economy of a country is a physically bounded system and price signals alone cannot capture physical limits. An example of the physical limits for a low-carbon transition is the maximum plausible rate of building new infrastructure such as renewable energy capacity or improving the energy-efficiency of buildings.
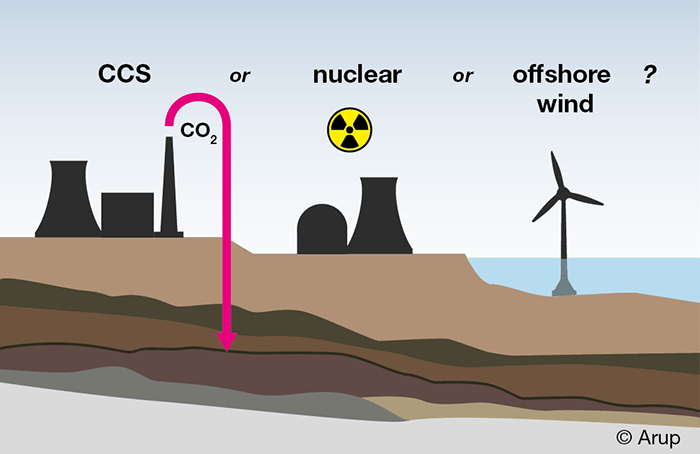
Image provided by Arup.
All economies have a limited capacity to create the extra goods and services needed. Any physically plausible scenario for a low-carbon transition needs to incorporate how much output from an economy must be diverted to building new infrastructure. Diverting this output has systemic effects on other economic interactions, such as employment.
An engineering perspective: data, data, data
What do we mean by an engineering perspective? Consider, for example, national energy-balance data accounting for all sources and uses of energy, often represented in a Sankey diagram format (Fig. 1). We can view energy as a flow (terajoules per year, TJ/y) from sources to final use. Some energy flows are transformed at infrastructure, such as the generation of electricity using combustion. Generating capacity (gigawatts, GW) is a stock, from which we can compute and exploit real thermal efficiencies, say.
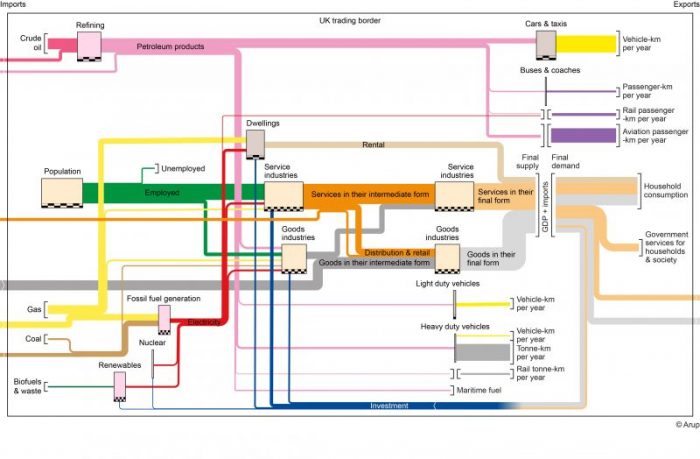
Figure 1 – Sankey diagram of the flows of products, travel, and jobs for the UK economy in 2016. The width of the infrastructure boxes varies according to the size of these stocks. All horizontal flows are to the right with the exception of “Investment”. Image provided by Arup.
We draw a comparison with the formalism of National Accounts for economic volume flows. The starting point is the value added by companies producing and supplying each other with intermediate goods and services, plus imports. Final demand is defined as household consumption and rental, government services, exports, and, crucially, investment (the creation of assets, fixed capital). The formation of fixed capital (investment) is the goods and services for maintaining and building new infrastructure.
Whether for energy or economic volume flows, these principles of stocks, flows, and real-world data can be applied to a whole economy. The datasets we can mine include the National Accounts (GDP data), infrastructure quantified by fixed capital, energy supply, and use, transport, population, and housing. We are looking for flows balance data and stocks of capacity to transform flows. Where flows are converted at a stock of capacity, we can derive from historical data time-varying coefficients for output flows and input requirements (Fig. 3). All these are available, as shown in Fig. 1 with stocks represented by widths of boxes, yet surprising, as far as we know, none applied in a stocks-and-flows model.
Transparent modeling principles
For any dynamic system, there is a question of its driving force or what maintains its momentum. In the case of an economy, this is the holy grail of governments, central banks and society alike (not to mention economists). Final demand calls upon the supply of goods and services. In turn, their production at fixed capital calls upon demand for inputs of energy, jobs and other goods and services. But while an economy is taken as demand-lead, it is constrained in the short term by the stock of fixed capital available to produce goods and services.
Here is our point of departure from many economists’ models. Their optimizing approach means they stay at one point in time, iterating prices until supply equals demand – the market is cleared – within their constraints of money supply and interest rates for borrowing. Their approach is dependent on price elasticity, meaning how much supply and demand might alter as prices change.
In contrast, our system dynamics model runs forward continuously in small time steps and applies feedback control loops. In our model, rising demand can only be met by signaling for more investment to expand infrastructure in subsequent time steps. Since investment is one component of final demand, its changes are part of demand-lead consequences rippling back through the economy. Our simple yet powerful proposition is that future scenarios should also produce national accounts, as much as an energy balance, for each future year. Why should not each year of a scenario also not comply with the same accounting constraints?
UK case study
Illustrating our model using the fastest plausible build rates for wind, nuclear, and CCS (carbon capture and sequestration) in the UK reveals interesting trade-offs for policymakers. Current UK projections for a low-carbon transition rely on substantial investment in CCS for fossil fuel generation. Our first alternative to implementing CCS is an expansion of nuclear new-build at the fastest plausible rate. This does not achieve as large a reduction in emissions and there is a notable delay owing to the long lead-time of construction (Fig. 2). However, it costs less than implementing CCS.
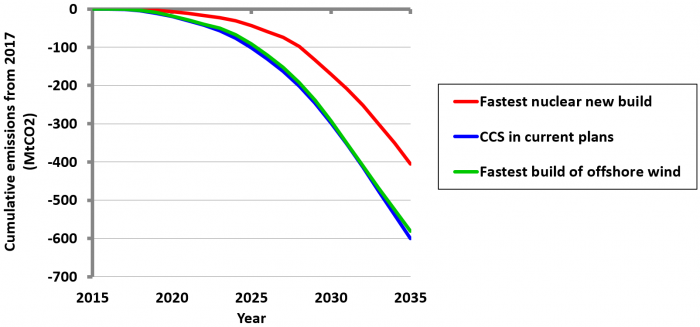
Figure 2 – Modelled cumulative emissions reduction from 2017 of utilities with respect to business as usual for 3 options. Credit: Simon Roberts and Colin Axon.
Our second alternative is to double the planned offshore wind electricity production and a reduced expansion of nuclear new-build. This can be achieved by reduced whole-economy investment in fixed capital compared to the CCS option. Furthermore, this transition will lessen energy security concerns by decreasing the reliance on coal and gas supply chains of CCS. Our study shows that replacing CCS with offshore wind is a feasible investment strategy. The cumulative carbon emissions from 2017 to 2035 would be reduced by about 200 MtCO2 for either CCS or offshore wind compared to the option of the fastest nuclear new build (Fig. 2).
For the whole package of low-carbon measures in the UK plans, the investment in fixed capital (in a whole-economy sense) for the lower emissions scenarios is 19% higher than a business as usual scenario (BAU) by 2035. The highest cost scenario includes the CCS deployment, peaking in the late 2020s. Both the fastest plausible build rates for wind and nuclear are significantly cheaper, though generally wind is the lowest.
The economy-wide impacts of the full low-emissions plans to 2035 are that the increasing investment needed will increase from 12% to 15% of GDP for BAU. This 3% additional investment will need final demand to be diverted from another end-user in the economy, such as from household consumption. Though this reduction would be comparatively small, nevertheless, the policy measures for these investments will need strong political leadership and broad support to mitigate the challenges by critics that this noticeably reduces the standard of living. Policymakers must emphasize that unemployment is not impacted by the package of measures as there will be a shift in employment from jobs in the service industry to construction of the order of 230,000 by 2035.
Lessons learned
The importance of our approach is that our modeling framework is applicable to any nation. Almost all nations assemble consumption and fixed capital data conforming to the United Nation’s System of National Accounts. Our model is a powerful tool once combined with energy, transport, and population data. For example, the time series trends of the number of jobs needed per unit output for the service industry show striking similarities across a range of countries (Fig. 3).
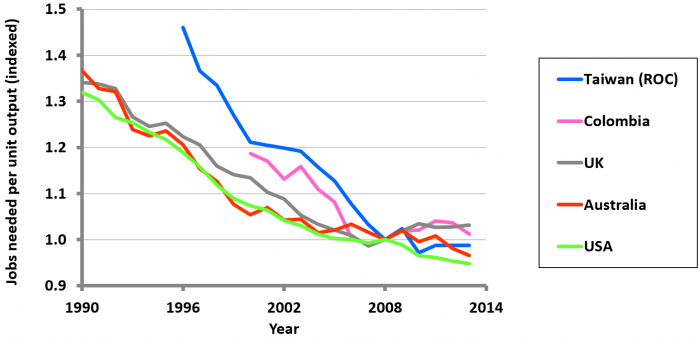
Figure 3 – Historical time series data for jobs needed in the service industry per unit output, indexed to 2008. Credit: Simon Roberts and Colin Axon.
Examining the whole-economy outcomes has led us to two conclusions. Firstly, financial productivity can be maintained with high employment driven by an expanding service industry. Secondly, any inability to deploy CCS technologies on schedule or a delay in implementing the fastest plausible build rates for new nuclear could be covered by an equivalent production capacity in offshore wind with similar financial and employment outcomes.
These findings are described in articles entitled Consequences of selecting technology pathways on cumulative carbon dioxide emissions for the United Kingdom, recently published in the journal Applied Energy, and Modelling socio-economic and energy data to generate business-as-usual scenarios for carbon emissions, recently published in the Journal of Cleaner Production. How data is selected for this modeling and represented as Sankey diagrams is described in A framework for characterising an economy by its energy and socio-economic activities, published in Sustainable Cities and Society. How they are calibrated is described in A robust data-driven macro-socioeconomic-energy model, published in the journal Sustainable Production and Consumption. The work was conducted by Simon H. Roberts (Arup, London, UK) Colin J. Axon (Brunel University London, UK), Barney D. Foran (Charles Sturt University, Australia), Benjamin S. Warr (INSEAD, France), and Nigel H. Goddard (University of Edinburgh).


