


Going for an outdoor walk in our cities for taking fresh air, enjoying a panorama, sight seeing a monument, or shopping and having a drink can be a great recreational experience. Some features that come across our field of view, though, can be disturbing or irritating, engendering a negative sensation. Imagine you are sitting in a square in front of a town cathedral and suddenly, a large truck stops right in your view to unload beer supplies to a neighboring bar. After a while, sun reflections from a solar panel installed on a surrounding rooftop hit your eyes; then you stand up and look for the post office sign walking down in a commercial street, but you cannot find it in the jungle of shop brands. You are facing the impact of visual pollution.
Visual pollution is a combined effect of confusion, disorder, and mix of different objects and graphics in the environment. Examples are outdoor advertisements, billboards, street furniture, road signs, waste collection points, parked vehicles, hydraulic fixtures and tubes, wires and cables, and mobile communication antennas. Especially in urban environments, these items can affect observers’ attention. Beyond their emotional and psychological influence, some of these features can be harmful or dangerous: lighting and blinking features can induce inattentional disturbance and epilepsy seizures; potential glare sources are distracting for drivers, like artificial lighting emitters and also highly reflective surfaces, like mirrors.
Several visual impacting elements, including advertisements, can be integrated into building envelopes — in other words, rooftops and façades. In particular, solar modules for photovoltaic or thermal energy production are often overlaid on the outdoor exposed surface of buildings, increasing their reflectivity and the consequent glare induction risk. Assessing the visibility of these elements from the public space may help prevent uncomfortable situations and estimate a reasonable application range that meets the widest social acceptance, in coherence with the local context.
In this framework, an extensive work has been done to provide a scale-dependent methodology to assess visibility in urban areas, from the strategic broad territorial scale to the district level, even the neighborhood or the cluster of buildings. With the specific aim to include it as a variable in a multi criteria model, a scale-adaptive visibility index is determined. At the broader scale, visual interest and viewshed based indicators are proposed. At the district scale, photometric models and ray-tracing techniques are explored to mimic human vision and identify the perceived areas of building envelopes that can potentially host solar modules.
At the strategic planning level (about 1 : 100 000 – 1 : 30 000), buildings and neighborhoods are dissolved into districts, which represent the data aggregation level of the map. Listed zones in land use plans can be a good exemplification of highly sensitive areas in terms of socio-cultural relevance. Visibility, instead, is less related to geometrical or physical phenomena, but rather to the mass perception of a place as its global visual interest within the “public.” Such a “collective interest” can be estimated by mapping the squares, the road axes, the sightseeing points that are (or have been) more significant in the cultural representation of the city. A widespread indicator can be computed with the density of photos taken in a given territory, with a higher density meaning a higher interest. An example of this computation for the metropolitan area of Geneva is shown in Figure 1, with a partial overlap of the most photographed zones and the most sensitive zones (city center).
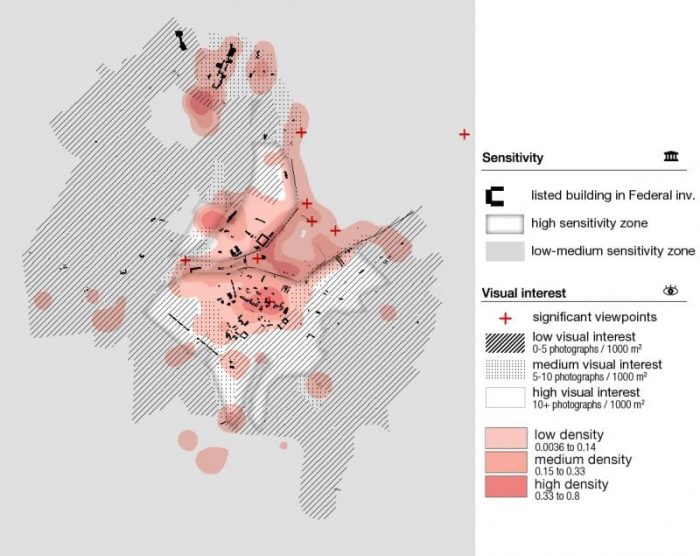
Figure 1: Geneva, Switzerland. Match between socio-cultural significance of urban areas (sensitivity) and visual interest issued from the density of photographs. Elaboration on CC data from Flickr © and Système d’Information du territoire à Genève – SITG. Credit: Pietro Florio
At the scale of urban development (about 1 : 10 000 – 1 : 2500), the urban fabric becomes visible: blocks of buildings represent the granularity of the map. Visibility depends mainly on geometric factors and reciprocal obstructions. It means that, at this stage, it is more important to know whether a surface on the envelope can eventually be visible or not, and from how many unobstructed locations, rather than trying to quantify the degree of physical perception from each viewpoint. A suitable indicator for this purpose is the “cumulative viewshed” (also known as “times seen”), which counts the number of times each building surface is intercepted by a visibility ray coming from several points sampled on the public space (Figure 2).
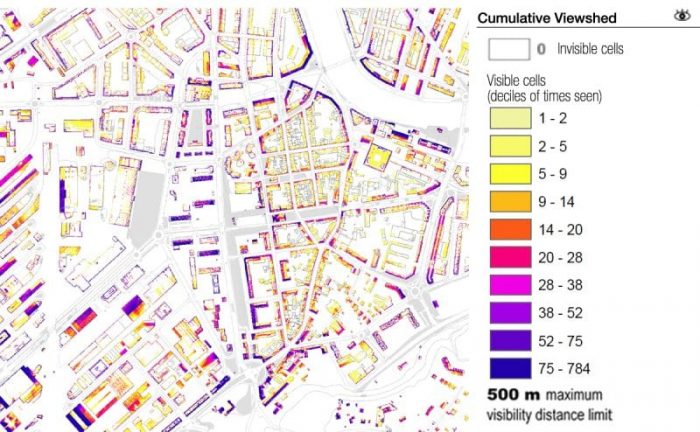
Figure 2 : Carouge, Geneva, Switzerland. Cumulative viewshed per deciles of « times seen ». Elaboration on CC data from Système d’Information du territoire à Genève – SITG. Credit: Pietro Florio
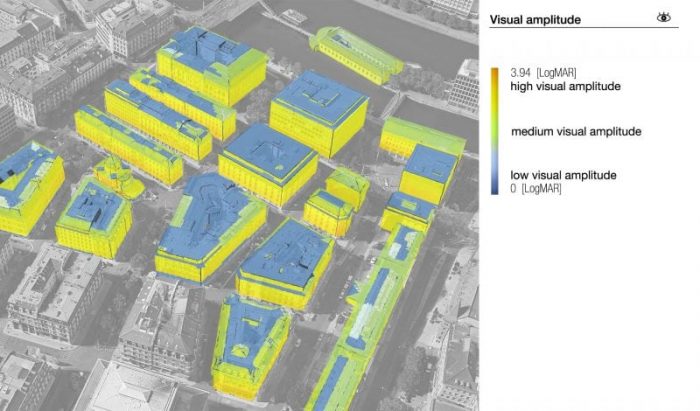
Detailed planning level (about 1 : 2000 – 1 : 500) entails the resolution of building components. Differences among façades and roof pitches become relevant at this stage as well as urban furniture (lamps, benches, advertisement …) and vegetation occlusion; envelope surfaces represent the granularity of the map. Visibility is now dependent on physical factors such as visual acuity and contrast, and has to be quantified for each envelope surface beyond the simple distinction of “visible”/“invisible” features made in the previous stage. To do so, visibility rays are cast from a grid of possible viewpoints in the public space to building surfaces, representing potential solar installation spots: visual stimulus is quantified as the solid angle produced by a target surface on the spherical visual field of each viewpoint in relation to its perceptual threshold. This ratio can be converted to a metric everyone is familiar with, the LogMAR visual acuity measure: it is the issued from the typical test of “reading the characters” performed by an optician.
Figure 3 shows this index, here mentioned as “visual amplitude” (VA), calculated on a 1.50 m resolution mesh on building surfaces of the “Hollande” district in Geneva, Switzerland. Contributions from a set of viewpoints are averaged to get a mean visual amplitude index per mesh face. It can be noticed how flat roofs are non-visible, especially from narrow streets, and façades are more visible than tilted roof pitches.
The above-mentioned methods are useful to quantify visibility on an objective basis and can be matched with solar energy generation potential for planning purposes. Other possible practical applications include the optimal placement of outdoor advertisements or the establishment of maximal brightness thresholds for luminous signs.
Source: P. Florio, C. Roecker, M.C. Munari Probst, J.-L. Scartezzini. Visibility of building exposed surfaces for the potential application of solar panels: a photometric model, in: Proceedings of UDMV 2016. Presented at: Urban Data Modelling and Visualization Workshop 2016 (UDMV), Liège. Credit: Pietro Florio
These findings are described in the article entitled Assessing visibility in multi-scale urban planning: A contribution to a method enhancing social acceptability of solar energy in cities, recently published in the journal Solar Energy. This work was conducted by Pietro Florio from the Solar Energy and Building Physics Laboratory of the École Polytechnique Fédérale de Lausanne (EPFL) in the framework of the PhD Thesis N°8826, co-supervised by Prof. Dr Jean-Louis Scartezzini and Dr Maria Cristina Munari Probst. The author is also grateful to Dr Andreas Schüler and Christian Roecker for their sound advices during the latter.
Related Posts
 Duck-Billed Dinosaurs Uncovered In Aniakchak, Alaska
 Cryptic Diversity In Vietnam’s Limestone Karst Habitats
 An Improved Method To Remove Debris From Cyst Nematode Egg Suspensions And Computer-Aided Technologies For Egg Counting
 The Footprints Of Urbanization, Industrialization, And Agriculture On River Beds: Heavy Metal Contamination Assessment And Source Identification In River Sediments In Eastern China
 Aging Dolphins Via Pectoral Flipper Radiography
 Glycoalkaloids In Potatoes: The Effect Of Biostimulants And Herbicides