
Did you know that coffee is the second most popular drink in the world, losing only to water? Current estimates indicate that more than 1 billion cups of coffee are consumed, worldwide, per day. Such popularity is mainly due to its beneficial physiological effects on health, good taste, pleasant flavor and attractive aroma.
Recent data indicate that global coffee exports amounted to 9.13 million bags in October 2016, with 0.9% estimated increase in global coffee production in 2015/16 as compared to 2014/15, showing that this market has a great growth trend. Besides that, its cultivation is present in more than 60 countries, standing out Colombia, Brazil, Indonesia, and Vietnam.
The generic name Coffea has approximately seventy species. However, from an economic point of view, the two most important species grown in the world are Arabica (Coffea arabica) and Robusta (Coffea canephora). Both species differ not only in relation to their botanical characteristics and chemical composition but also in terms of commercial value, with Arabica coffees presenting 20-25% higher market prices. Arabica coffee is originally from Ethiopia and cultivated only in areas above 800 meters of altitude and with a mild climate. On the other hand, Robusta coffee is adapted to conditions of an average annual temperature between 22-26°C, is resistant to droughts and tolerates altitudes below 500 meters. Thus, Robusta is more resistant to diseases and grows on flat lands, leading to an easier and mechanized production.
In general, from a sensory standpoint, Arabica coffee provides better quality beverages. Therefore, the best quality coffees generally contain only Arabica varieties. As Robusta has lower prices compared to Arabica, the preparation of blends is highly feasible. Therefore, the lower cost of Robusta coffee beans opens the possibility for commercial frauds, especially those related to 100% Arabica blends, making detection and quantification of such mixtures in commercial samples a necessary analytical tool for consumer protection.
It is important to remember that, considering the green coffee beans, the difference between Robusta and Arabica can be visually observed (Fig. 1), because Arabica beans are typically bigger than Robusta ones. Furthermore, differences in color and shape are also normally noticeable. However, after roasting and grinding, this discrimination is not more noticeable.
A wide variety of analytical techniques can be used for analyzing coffee. Among them, vibrational techniques, such mid-infrared (MIRS) and near-infrared (NIRS) spectroscopies, are particularly appropriate due to the possibility to obtain direct, simple, non-destructive and fast measurements, without the need of sample pretreatment. However, these techniques provide overlapped signals, demanding the combined use of multivariate (chemometric) tools. In this type of analytical strategy, the chemical or physical separation of the interferences is replaced by the mathematical separation of their signals.
Chemometrics can be defined as “the art of extracting chemically relevant information from data produced in experiments”. Practically, chemometrics is an interface between chemistry and applied multivariate statistics, which originated in the 1960s when scientific computing became accessible. The development of chemometrics is closely related to the computational development and, as a consequence, to the advancement of analytical measurement instruments that increasingly provide a large volume of data, requiring multivariate methodologies for their interpretation.
For this work, partial least squares (PLS) was applied. It is a regression method that seeks to model the maximum correlation between two blocks of variables, X matrix (independent variables; spectra or other analytic signals), and y vector, or Y matrix, which contains the dependent variable(s).
The aim of this work was the development of a robust and direct method for quantifying Robusta variety in Arabica-Robusta blends of roasted and ground coffees by combining ATR-FTIR (attenuated total reflectance Fourier transform infrared spectroscopy), PLS and different variable selection methods (an important step to eliminate noisy variables that are not related to the property of interest.). The improvement of the methodology was demonstrated by testing four different variable selection methods: OPS (ordered predictors selection), iPLS (interval PLS), SPA (successive projections algorithm) and GA (genetic algorithm).
In this way, the raw materials used in this work, dried and hulled green beans, were obtained directly from tens of farmers in the States of Minas Gerais and Espirito Santo, in Brazil. Samples were separately roasted at three different temperatures, 185, 195, 205 oC, corresponding to light, medium and dark roasting levels, respectively. After roasting, samples were ground at room temperature in a home coffee grinder, and sieved (40 mesh). Blends were prepared in different proportions of Robusta in Arabica coffee (0-33%, increments of 1%). This concentration range was chosen because different sensorial studies have indicated that the maximum content of Robusta not perceivable in coffee beverages is 35% for the aroma and 40% for the taste. Blends (10g) were placed in plastic bags and stored in a refrigerator (Fig. 2).
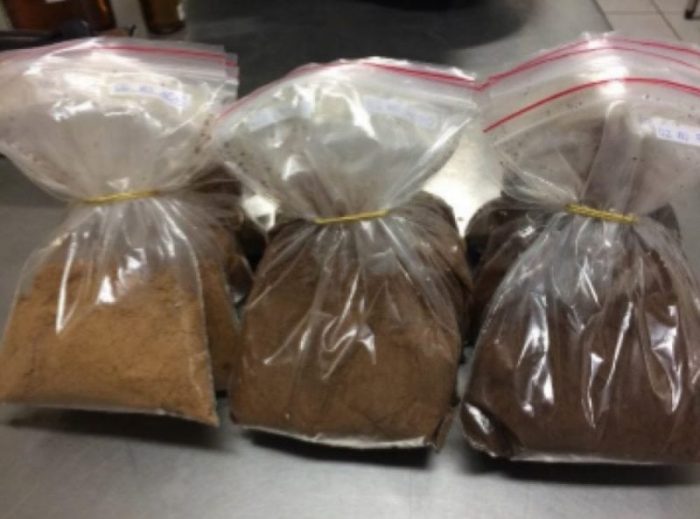
Fig. 2. Arabica coffee samples at different degrees of roasting: light, medium, and dark. Credit: Marcelo M. Sena
Spectra were obtained in an IRAffinity-1S spectrometer (Shimadzu) equipped with a horizontal ATR accessory. All data were processed using MATLAB software, together with the PLS_Toolbox. The lines of the spectral data matrix X correspond to samples (N = 40) and the columns correspond to variables (3320). This matrix was correlated with a vector containing the percentage of Robusta coffee in the blends.
Specific models were built for each roasting level, and a general robust model was obtained with samples of all the three roasting levels. Finally, a full multivariate analytical validation was performed in order to assure the reliability of the developed method. MIR spectra of all the analyzed samples are shown in Fig. 3.
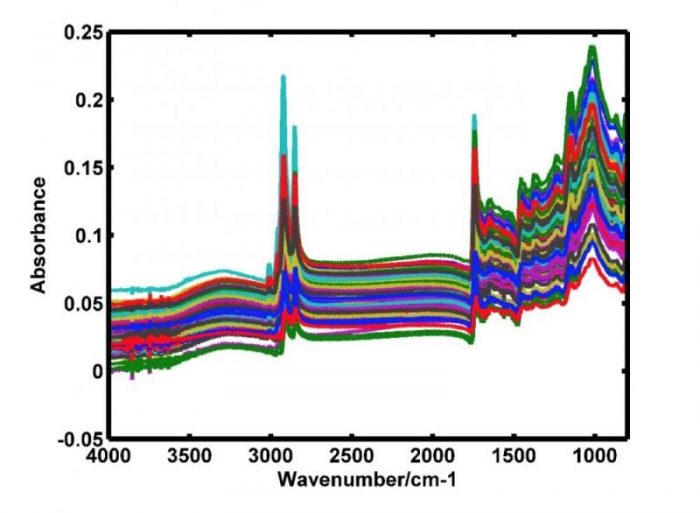
Fig. 3. MIR spectra of all samples. Credit: Marcelo M. Sena
By observing Fig. 3, it can be noted that spectra are visually quite similar. Apparent differences are essentially in the absorbance intensities. Many peaks present are related to specific types of bond vibrations, such as C-H stretching of hydrocarbons, O-H stretching of carboxylic acids and asymmetric stretching vibration of C-H bonds of methyl (-CH3) groups, stretching vibration of the carbonyl bond, C=C stretching from nitrogenous rings, axial C-O deformation vibration, among others.
For building PLS models, spectral regions between 4000-3600 cm-1 and 2820-1765 cm-1 were deleted, because they did not present significant absorptions, contributing only to noise. In general, variable selection improved the models. While iPLS and iSPA-PLS did not significantly improve the results, OPS and GA provided a great increase in the predictive ability of the multivariate calibration models. All models, after the application of GA and OPS, provided satisfactory statistical parameters, indicating that they can be applied in routine analyses.
In addition to specific models built exclusively for coffee blends obtained at specific degrees of roasting, a robust model incorporating all the samples was also built. This is the most important model of this work because it can be applied to any sample, independent on its roasting level. This robust model, after variable selection by OPS, also provided satisfactory errors, indicating that only one model can be applied, contemplating all the degrees of roasting.
The results of the multivariate analytical validation showed that, overall, the robust model provided parameters somewhat worse than specific models built at each roasting level. This was expected, considering the higher variability of the samples included in this model. For the robust model, root mean square errors of calibration and prediction were equal to 1.1 % and 1.8 %, respectively.
Also, the linearity of the models was evaluated by analyzing the fit of the reference versus predicted values. These plots for all the four models are shown in Fig. 4, in which no systematic trend is observed for the residual distributions. For all models, the correlation coefficients were above 0.94.
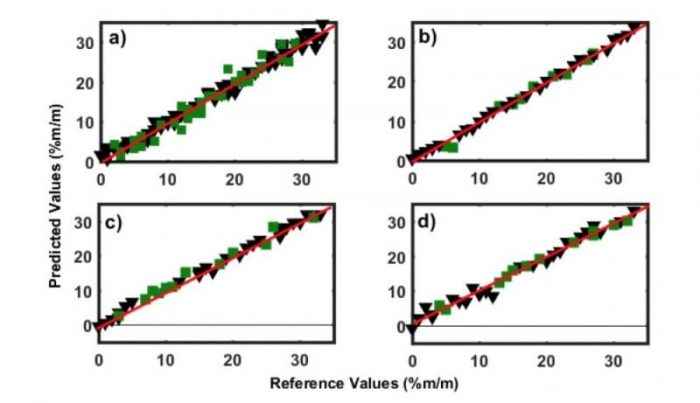
Fig. 4. Reference versus predicted values for a) robust, b) light roast, c) medium roast and d) dark roast models. Credit: Marcelo M. Sena
In short, mid-infrared spectroscopy (ATR-FTIR), multivariate calibration (PLS) and variable selection were combined for developing a simple, rapid and non-destructive method for determining Robusta content in coffee blends. Specific models were developed for ground coffee samples obtained at three different roasting levels. Nevertheless, the most useful and robust model was obtained with samples including a lot of variability, such as different origins and roasting levels.
It is important to emphasize the importance of chemometrics in this kind of situations, which allows quantification even in the presence of interferences. This methodology does not require laborious sample preparation steps, does not consume reagents or solvents, nor generates chemical waste, according to the principles of green chemistry. All the models were validated and considered accurate, linear, sensitive and unbiased.
These findings are described in the article entitled Variable Selection Applied to the Development of a Robust Method for the Quantification of Coffee Blends Using Mid Infrared Spectroscopy, published in the journal Food Analytical Methods. This work was led by Marcelo M. Sena from the Universidade Federal de Minas Gerais.


