Coral bleaching events provide one of the most visual indicators of present-day climate change effects. From 2014 to 2017, the world experienced the longest recorded coral bleaching event in history (Eakin, Sweatman, & Brainard, 2019).
The third global coral bleaching event was caused by a three-year heatwave exaggerated by an El Nino, and the statistics are staggering (Eakin et al., 2018). More than 75 percent of Earth’s tropical reefs experienced bleaching-level heat stress, nearly 30 percent of reefs reached mortality level stress, and more than half of affected reef areas were impacted at least twice in the 3 years.
What is coral bleaching?
Coral bleaching is a phenomenon which occurs when a stressor (e.g., high temperatures) induces the expulsion of nutrient-providing coral symbionts from the host coral colony. As well as providing the majority of food for the host coral polyps, the symbionts (zooxanthellae) also provide part of the coral’s characteristic color. Once enough zooxanthellae have been expelled, the colony “bleaches,” i.e. turns white. A bleached coral is not dead, as is often mistakenly thought. However, it is in a weakened state, and if the stress and bleaching are sustained for a number of weeks or months, it can lead to the eventual death of the coral.
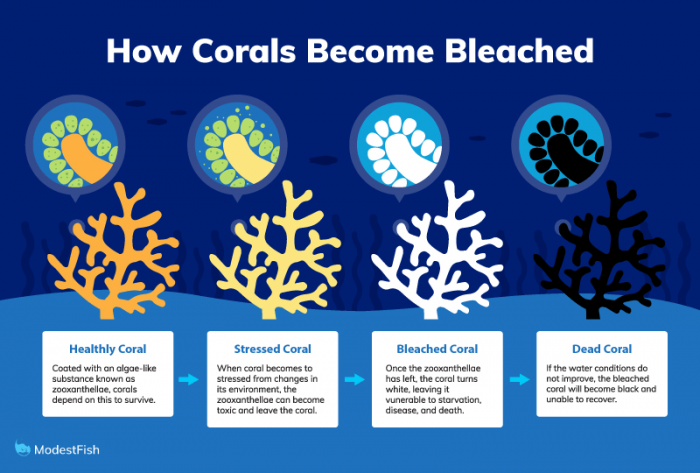
Figure 1. The stages of coral bleaching (graphic courtesy of ModestFish.com). Published with permission.
Although a number of factors can lead a coral to bleach, only high sea temperatures can cause bleaching to occur simultaneously over a large geographic expanse. A 1°C increase in temperature above the summer average can lead to bleaching (Heron et al., 2016).
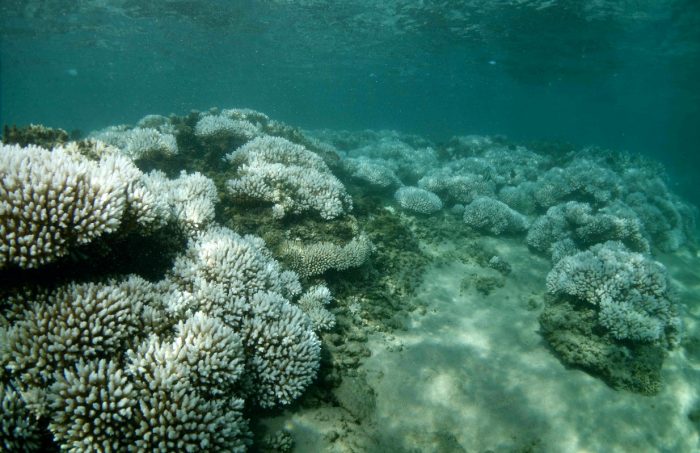
Figure 2. Bleaching at Saint-Leu, La Reunion in March 2016 Photo credits: Julien Wickel, MAREX. Published with permission.
Mass coral bleaching due to rising global temperatures
The first major global coral bleaching event happened in 1998 due to a record-breaking El Nino, which caused the death of an estimated 16% of corals worldwide (Wilkinson, 2000). The second occurred in 2010, although it was far less severe (Guest et al., 2012). The 3rd global bleaching event started in the western Pacific Ocean in 2014 (NOAA, 2016) and was covered by a number of media outlets with particular attention awarded to the Great Barrier Reef in 2016 and 2017, after large swathes of the North (2016) and Central (2017) reef complexes suffered significant (but not total, as was frequently reported) coral mortality (Ainsworth et al., 2016; ARC Centre of Excellence for Coral Reef Studies, 2017; Slezak, 2016).
Another region which was impacted by the global event in 2016 was the Western Indian Ocean (WIO). The WIO consists of 9 countries (Comoros, Kenya, Madagascar, Mauritius, Mozambique, Seychelles, Somalia, South Africa, and Tanzania) as well as French overseas territories. Coral reefs in each of these countries support some of the most marginalized and impoverished communities in the region as well as high-value economic sectors (e.g. tourism, fishing).
Coral bleaching in the Western Indian Ocean
The WIO has a history of mass bleaching events, with the 1998 event causing particular devastation with the death of between 50-90% of coral at many reefs (Wilkinson & Hodgson, 1999). There have also been smaller events since then affecting parts of the region. In 2016, during the bleaching season (January–May), reef sites on average experienced 5.4 Degree-Heating-Weeks (DHW), with some sites experiencing up to 15 DHW. Generally, DHW above 4 is enough to cause some bleaching, while conditions above 8 can cause severe coral death (Kayanne, 2017).
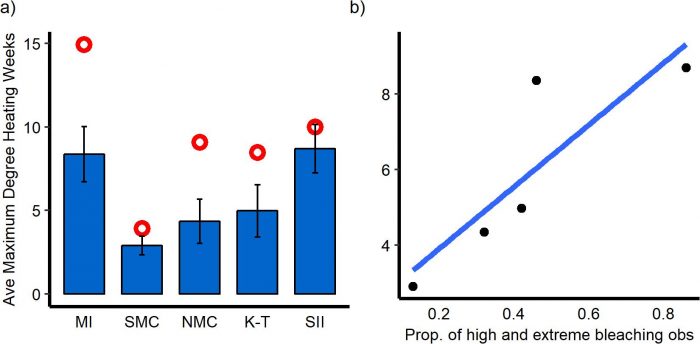
Figure 3. a) The average maximum Degree-Heating-Weeks (DHW) for each geographic cluster from January to May 2016. The maximum DHW value within each cluster is shown by the red circle, and bars represent standard deviation from the average. (n, MI= 118, SMC = 54, NMC= 220, K-T=95,SII=24) b) Correlation between average maximum DHW and proportion of high and extreme bleaching records per cluster (R2=0.74). MI – Mascarene Islands, SMC – Southern Mozambique Channel, NMC – Northern Mozambique Channel, K-T- Kenya and Tanzania, SII – Seychelles Inner Islands. Reprinted by permission from [the Licensor]: [Springer] [Coral Reefs] (Participatory reporting of the 2016 bleaching event in the Western Indian Ocean, Gudka M., Obura D., Mbugua J., Ahamada S., Kloiber U., Holter T.), [COPYRIGHT] (2019)
This study used a participatory approach to gather data from across the WIO during the event and found that during the peak of the bleaching (March-May), 91% of the 412 sites were reported to have bleached, with over half the corals bleaching at 37% of these sites.
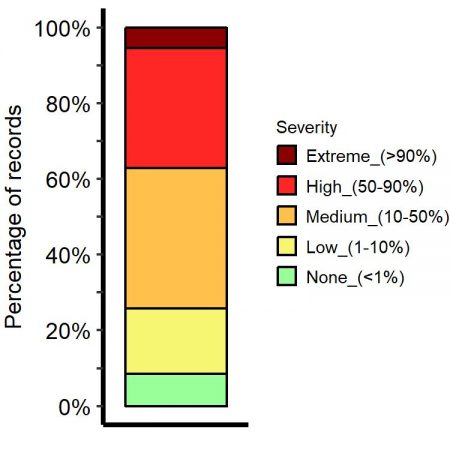
Figure 4. Proportion of bleaching records per severity category (estimates of percentage coral cover that was bleached) during the peak period of bleaching in the Western Indian Ocean (March-May 2016); n=412 records. Reprinted by permission from [the Licensor]: [Springer] [Coral Reefs] (Participatory reporting of the 2016 bleaching event in the Western Indian Ocean, Gudka M., Obura D., Mbugua J., Ahamada S., Kloiber U., Holter T.), [COPYRIGHT] (2019)
The data were collected through a simple Google Form and via email, with various stakeholders across the region (e.g. general public, scientists, reef managers, divers) contributing to the initiative. A total of 698 records were obtained from 55 organizations and over 80 observers. This was the first effort in the WIO to gather bleaching data at this scale during a major bleaching event using participatory tools. Seychelles was the most affected, with 90% of reported sites showing high or extreme bleaching (over 50% of corals bleached), followed by Tanzania, Comoros, Reunion, and Mauritius.
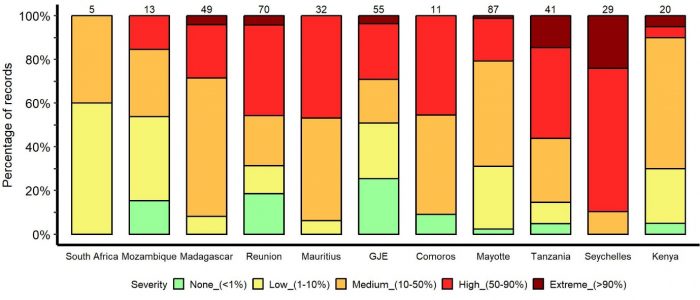
Figure 5. Proportion of bleaching records per severity category (estimates of percentage coral cover that was bleached) during the peak-bleaching phase (March-May 2016) for 11 Western Indian Ocean territories (islands and countries arranged from south to north). The number of records are shown above the columns. GJE is an abbreviation referring to the Islands of Glorieuses, Juan De Nova and Europa. Reprinted by permission from [the Licensor]: [Springer] [Coral Reefs] (Participatory reporting of the 2016 bleaching event in the Western Indian Ocean, Gudka M., Obura D., Mbugua J., Ahamada S., Kloiber U., Holter T.), [COPYRIGHT] (2019)
Sites in the Mozambique Channel, both in the south and the north, were the least affected. Additionally, over 60% of sites experienced some level of bleaching-induced coral mortality from April onwards.
It’s not all bad news though, with corals at some sites and areas recovering from bleaching and returning back to normal health. This is most likely due to a sudden cooling of temperatures at the end of the hot season, which minimized the window of thermal stress. This high survivorship and exposure of corals to progressive heating year after year could lead to acclimation of the corals and possibly a more resistant community.
The not-so-distant future
The study has shown that a variety of interested groups can contribute toward bringing attention to bleaching events as they occur. However, with mass bleaching events likely to become more frequent and intense in the next few decades as a result of global warming (Hughes et al., 2017), it is becoming increasingly important that stakeholders are involved in local efforts such as managing over-fishing and improving water quality. These efforts will minimize the vulnerability of corals to high temperatures and/or increase recovery potential after bleaching. Additionally, and arguably more importantly, it is very apparent that drastic global climate actions to reduce carbon dioxide concentrations in the atmosphere are urgently required, with time running out to limit global temperature rise to survivable levels for reefs.


