


As an observed fact, global climatic warming since the Industrial Revolution has caused more frequent heat waves across the world. Recent examples include the record-breaking heatwave in Europe in 2003, which caused >70,000 deaths (Robine et al., 2008) and the 2010 heat wave in Russia with approximately 20,000 excess deaths (Revich and Shaposhnikov, 2012). It affects the health of workers and caused a tremendous increase in work productivity loss, thus leading to economic losses.
How do heat events affect work productivity? On the one hand, heat stress might increase mortality and morbidity, mainly due to respiratory and cardiovascular disease, which have attracted considerable attention (Pfaffenbach and Siuda 2010). On the other hand, heat stress affects the health of workers and reduces the work productivity by changing the ambient working environment, which causes absenteeism and a decrease in work capacity and productivity (Pfaffenbach and Siuda 2010; Großmann 2012).
Previous research showed that when physical activity is high in a hot working environment, the worker is at risk of an increased core body temperature (above 38°C), making the human physiological mechanisms hard to cope with (Kjellstrom et al., 2009). It may decrease both their mental and physical capacity.

Credit: Pixabay
However, the method to quantify the impact of heat stress on work productivity has remained an issue to scientific researchers and policymakers. A commonly accepted indicator for measuring the capacity to work is the wet bulb globe temperature (WBGT) index (Kjellstrom et al., 2009; Kjellstrom et al., 2017), which is based on meteorological records. However, although there is agreement that work productivity decreases with increasing WBGT, this simple index can hardly reflect the regional difference of heat adaptability and the impacts of other non-meteorological factors, such as worker’s clothing, acclimatization, and microenvironment (Budd, 2008).
Surveys based on social-science studies have been applied in an attempt to quantify the impact of heat stress on work capacity. However, previous surveys were mainly used for developed countries, and the number of samples was usually very small (hundreds or even tens) — not suitable for identifying regional differences around the world. The worldwide pattern of heat-related work productivity loss has, thus, remained unclear.
YU Shuang, XIA Jiangjiang, and YAN Zhongwei from the Institute of Atmospheric Physics, Chinese Academy of Sciences, together with colleagues from China and the UK, focused on the effects of heat stress on work productivity for different countries around the world and pointed out particularly vulnerable regions from a new point of view. They synthesized valid data from 4363 respondents of a global online survey in 2016. This is the most extensive global survey of the effect of heat stress on work productivity currently available. Participants were not only from Europe, North America, Australia, and East Asia, where the heat wave effects have been relatively well-studied, but also from South Africa, Southeast Asia, Central Asia, South America, etc., where are the regions most affected by climate change but have not receive the most attention, due to limited data and information is available.
Based on the global survey, they quantified the effects of heat stress on work productivity in different countries for the year and identified regions of vulnerability to heat events that might have been overlooked in the past. Meanwhile, future work productivity losses are deduced for each country in 4 cases with the global mean surface temperature increasing by 1.5°C, 2°C, 3°C, and 4°C, respectively, under the representative concentration pathways (RCPs) scenarios (greenhouse gas concentration trajectory adopted by the IPCC and aims to represent the different atmospheric concentration change and climate futures).
The results show that the averaged work productivity loss for developing countries/regions is 6.6 days, compared to 3.5 days lost for developed countries/regions in 2016. Workers in tropical countries are likely to be at the highest risk of heat stress. This result is consistent with the conclusion of previous studies which based on the heat exposure index (Dunne et al., 2013). In addition, the present research based on the global survey data did identify some other vulnerable regions that could have been overlooked in previous, such as Central Asia and northern Europe due to relatively low adaptability to heat (Figure 1).
The work productivity loss has a significant negative linear relationship with Gross Domestic Product Per Capita, indicating that the work productivity loss is inversely proportional to the level of development of a country (Figure 2).
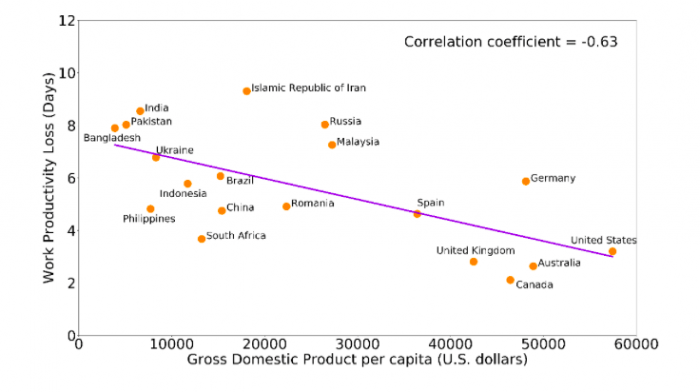
Figure 2. Linear relationship between the loss of work productivity (days) and GDPPC (US dollars) based on results from 19 countries/regions. Image courtesy Xia Jiangjiang
Warming could exceed the 1.5°C, 2°C, 3°C, or 4°C limit by about the 2030s, 2040s, 2060s, or 2070s, with an exceeding year under high emissions scenario earlier than low emissions scenario. In a 1.5°C warming world, the loss is almost three-fold as many as that in 2016. The work productivity loss will be 12 (31) days for developed (developing) countries. In a much severe, 3°C warming world, the work productivity loss is 22 days for developed countries, but two months for developing countries.
When global temperature increases 4°C, the work productivity loss is a little longer than one month for the developed countries, but almost three months for developed countries. It means that those developing countries, which are particularly vulnerable to climate change, would receive much more adverse effects of global warming than developed countries.
Remarkably, countries in Southeast Asia (the most influenced region) in a 1.5°C-warming world would suffer the same loss as the developed countries would in a 4°C-warming world. This quantitatively addressed the severe situation that developing countries would face under global warming. It is important to recognize regional differences in setting global mean warming targets and developing the adaptation strategy. The results are helpful for worldwide decision-makers to consider how to mitigate and adapt to global warming from a particular point of view.
These findings are described in the article entitled Loss of work productivity in a warming world: differences between developed and developing countries, recently published in the Journal of Cleaner Production. This work was conducted by Yu, Shuang, Xia, Jiangjiang, and Yan, Zhongwei from the Chinese Academy of Sciences and the University of Chinese Academy of Sciences, Zhang, Anzhi, Wang, Jun, and Chen, Liang from the Chinese Academy of Sciences, Xia, Yang and Guan, Dabo from the University of East Anglia, Han, Jiarui from the China Meteorological Administration, and Liu, Yakun from the Beijing Information Science and Technology University.
Acknowledgments:
We are grateful to Amber Weather Company for providing a free online survey platform.
Cite this paper as:
Yu S, Xia JJ, Yan ZW, Zhang AZ, Xia Y, Guan DB, Han JR, Wang J, Chen L, Liu YK, 2019: Loss of work productivity in a warming world: Differences between developed and developing countries, Journal of Cleaner Production, 208(20):1219-1225, available at: https://linkinghub.elsevier.com/retrieve/pii/S0959652618330816.
References:
- Budd, G. M., 2008. Wet-bulb globe temperature (WBGT)—its history and its limitations. J. Sci. Med. Sport 11, 20–32.
- Dunne, J.P., Stouffer, R.J., John, J.G., 2013. Reductions in labour capacity from heat stress under climate warming. Nat. Clim. Change 3, 563-566.
- Großmann, K., Franck, U., Krüger, M., Schlink, U., Schwarz, N., and Stark, K.m, 2012 Soziale Dimensionen von Hitzebelastung in Grossstädten (english title: social dimensions of heat-stress in cities), disP – The Planning Review, 48, 56–68, doi:10.1080/02513625.2012.776818.
- Kjellstrom, T., Holmer, I., & Lemke, B., (2009). Workplace heat stress, health and productivity — an increasing challenge for low and middle-income countries during climate change. Global Health Action, 2(1), 46-51.
- Kjellstrom, T., Freyberg, C., Lemke, B., Otto, M., & Briggs, D. 2017. Estimating population heat exposure and impacts on working people in conjunction with climate change. International Journal of Biometeorology, 62(3), 1-16.
- Pfaffenbach, C. and Siuda, A., 2010. Hitzebelastung und Hitzewahrnehmung im Wohn- undArbeitsumfeld der Generation 50plus in Aachen, Europa Regional, available at: PID: https://www.ssoar.info/ssoar/handle/document/31492 (last access: 4 August 2015), 18, 192–206.
- Revich, B. A. and Shaposhnikov, D. A., 2012: Climate change, heat waves, and cold spells as risk factors for increased mortality in some regions of Russia, Studies on Russian Economic Development, 23, 195–207, doi:10.1134/S1075700712020116.
- Robine, J.-M., Cheung, S. L. K., Le Roya, S., van Oyen, H., Griffiths, C., Michel, J.-P., and Herrmann, F. R. 2008. Death toll exceeded 70,000 in Europe during the summer of 2003, C. R.Biol., 331, 171–178, doi:10.1016/j.crvi.2007.12.001.
Related Posts
 Duck-Billed Dinosaurs Uncovered In Aniakchak, Alaska
 Cryptic Diversity In Vietnam’s Limestone Karst Habitats
 An Improved Method To Remove Debris From Cyst Nematode Egg Suspensions And Computer-Aided Technologies For Egg Counting
 The Footprints Of Urbanization, Industrialization, And Agriculture On River Beds: Heavy Metal Contamination Assessment And Source Identification In River Sediments In Eastern China
 Aging Dolphins Via Pectoral Flipper Radiography
 Glycoalkaloids In Potatoes: The Effect Of Biostimulants And Herbicides