


More than two-thirds of people in the U.S. live in urban areas, which are facing huge challenges related to retrofit, expansion and operational efficiency to reduce resource use and greenhouse gas (GHG) emissions, and to meet sustainability goals and resiliency to combat nature extreme events and emergencies. Buildings in U.S. cities consume up to 70% of the total primary energy.
To achieve cities’ energy and climate goals, it is thus a key strategy to reducing energy use and GHG emissions in urban buildings through energy conservation and efficiency improvements. Urban building energy modeling (UBEM) is a powerful tool for cities and their energy planning consultants to assess the building stock and guide building retrofits at city-scale.
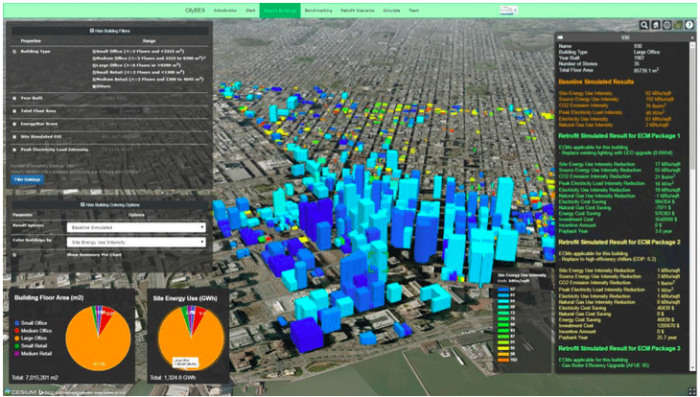
Figure 1. Screenshot of CityBES, showing color-coded simulated site energy use intensity for 940 buildings in San Francisco (Chen et al. 2017)
UBEM refers to the computational modeling and simulation of the performance of a group of buildings (from a city block to a district and to an entire city) in an urban context, to account for not only the dynamics of individual buildings but, more importantly, the inter-building effects (e.g., shading and radiant heat exchange) and the mutual influences between buildings and the urban microclimate, providing quantitative insights to inform urban buildings and energy policymaking. Considering urban buildings as part of the urban system (a system of systems) will enable a group of buildings to achieve greater performance than the simple sum of individual buildings.
The first and a critical step of UBEM is to develop a digital representation of building stock in cities which contain hundreds of thousands of buildings. Figure 2 shows the workflow used to create the dataset of San Francisco building stock. The land use, assessor records, and energy disclosure databases use the Assessor Parcel Number (APN) as parcel identifiers to store the building data. We first consolidated the parcel-related data and mapped them with the building footprint data to create a master building dataset with all the fields from each dataset. Next, the master dataset was simplified and standardized to create 3D city models in CityGML for all the San Francisco buildings. The Building Energy Data Exchange Specification (BEDES) was used to standardize the terms in the building dataset. The final dataset products were provided in CityGML, GeoJSON, and FileGDB formats that can be used by various urban modeling and analysis tools.
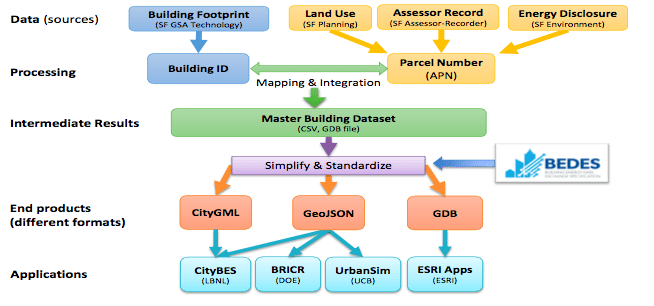
Figure 2 Data sources and workflow to create the city-scale buildings dataset (Chen et al. 2017)
CityGML is an international Open Geospatial Consortium standard for the representation and exchange of 3D city models. CityGML defines the 3D geometry, topology, semantics, and appearance of urban objects, including buildings and their components, bodies of water, city furniture (street lighting, traffic lights), transportation infrastructure (streets, roads, bridges, tunnels), and vegetation. CityGML has the flexibility of representing urban objects at various levels of details. For example, a building has five levels of representation as shown in Figure 3.
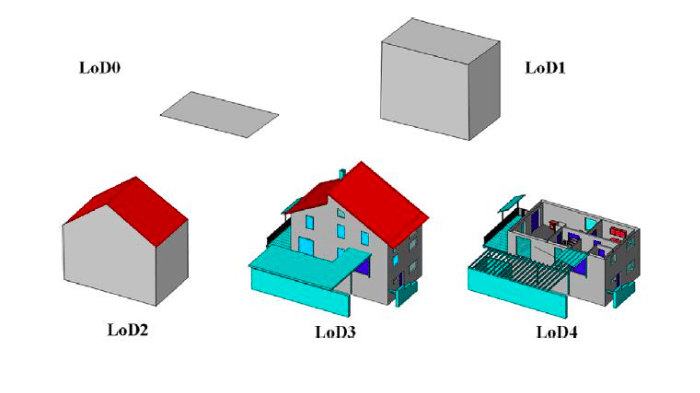
Figure 3: Five levels of details (LODs) to represent buildings in CityGML (Gröger et al. 2012)
This is an important feature as some buildings in cities have more information (e.g., those subject to city’s energy benchmarking and disclosure ordinance) while others have minimal public information (e.g., use type, year built, total floor area). Along the way, more information becomes available for more buildings and can be added to improve the CityGML representation.
The CityGML files were generated based on the CityGML 2.0 schema, particularly the building and generic parts. We mapped most building attributes to the standardized CityGML elements. For attributes (e.g., annual building site energy use) that cannot be mapped, they were named as CityGML generic types (::_GenericsAttribute). Thus all building attributes are included in the CityGML representation. Including all city buildings in a single CityGML file (at GB size) makes it hard to manage and process the file due to its large size. For the San Francisco case, we split the building stock into 15 planning districts with each represented by a separate CityGML file.
3D CityGML-based city models are then used in CityBES (Hong et al. 2016) for building energy modeling and analysis. CityBES is an open web-based data and computing platform to support district or city-scale building energy efficiency programs. CityBES employs EnergyPlus, a USDOE flagship of physics-based building energy modeling engine, to simulate building energy use and calculate savings from energy retrofits. Figure 4 shows CityBES’ three-layer structure: the data layer, the algorithm/engine software layer, and the application layer.
Main features of CityBES include: (1) 3D-GIS integrated visualization of building performance using a diverse set of metrics, (2) building energy performance benchmarking for building stocks in different cities, (3) energy retrofit assessment and prioritization, (4) rooftop solar PV potential evaluation, and (5) evaluation of typical types of district energy systems severing a group of buildings. CityBES targets urban planners and developers, city energy managers, building owners, utilities, energy consultants and researchers.
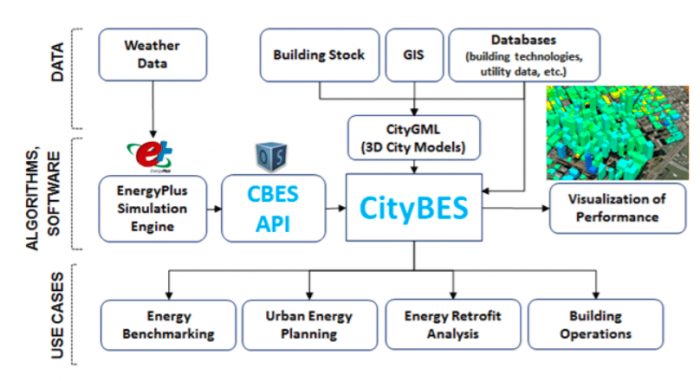
Figure 4. CityBES structure and use cases (Hong et al. 2016)
A case study was conducted using CityBES to demonstrate the automatic generation of building energy models and the workflow of energy retrofit analysis of 940 small- and medium-sized office and retail buildings in six districts of northeast San Francisco. The potential savings of energy use and energy cost of five individual energy conservation measures (ECMs) and two ECM packages were estimated using CityBES, as shown in Figure 5.
The results also show that: (1) all five measures together can save 23%-38% of site energy per building; (2) replacing lighting with light-emitting diode lamps and adding air economizers to existing heating, ventilation and air-conditioning (HVAC) systems are most cost-effective with an average payback of 2.0 and 4.3 years, respectively; and (3) it is not economical to upgrade HVAC systems or replace windows in San Francisco due to the city’s mild climate and minimal cooling and heating loads.
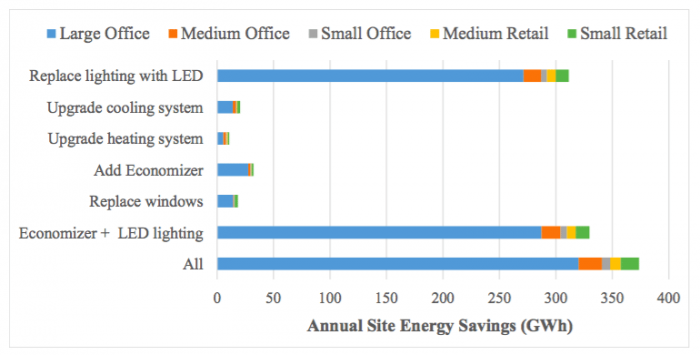
Figure 5. Annual site energy savings by building type for individual ECMs and ECM packages (Chen et al. 2017)
A key challenge in UBEM is to balance the accuracy of simulated results and model complexity, which has strong influences on computational resources. We conducted another study to evaluate the impacts of three zoning methods and the use of floor multipliers on the simulated energy use of 940 office and retail buildings in three climate zones using CityBES.
The first zoning method, OneZone, creates one thermal zone per floor based on the target building’s footprint. The second zoning method, AutoZone, splits the building’s footprint into perimeter and core zones. A novel, pixel-based automatic zoning algorithm is developed for the AutoZone method. The third zoning method, Prototype, uses the U.S. Department of Energy’s reference building prototype shapes. Results show that simulated source energy use of buildings with the floor multiplier are marginally higher by up to 2.6% than those modeling each floor explicitly, which take two to three times longer to run.
Compared with the AutoZone method, the OneZone method results in decreased thermal loads and fewer equipment capacities: 15.2% smaller fan capacity, 11.1% smaller cooling capacity, 11.0% smaller heating capacity, 16.9% less heating loads, and 7.5% less cooling loads. Source energy use differences range from -7.6% to 5.1%. When comparing the Prototype method with the AutoZone method, source energy use differences range from -12.1% to 19.0% and larger ranges of differences are found for the thermal loads and equipment capacities. This study demonstrated that zoning methods have a significant impact on the simulated energy use of UBEM. One recommendation resulting from this study is to use the AutoZone method with floor multiplier to obtain accurate results while balancing the simulation run time for UBEM.
These findings are described in two articles entitled Automatic generation and simulation of urban building energy models based on city datasets for city-scale building retrofit analysis, and Impacts of building geometry modeling methods on the simulation results of urban building energy models, recently published in the journal Applied Energy. The UBEM research work was conducted by Dr. Tianzhen Hong, Dr. Yixing Chen and Mrs. Mary Ann Piette from Building Technology and Urban Systems Division, Lawrence Berkeley National Laboratory.
References
- Chen, Y., Hong, T., Piette, M.A. Automatic Generation and Simulation of Urban Building Energy Models Based on City Datasets for City-Scale Building Retrofit Analysis. Applied Energy, 2017.
- Hong, T., Chen, Y., Lee, S.H., Piette, M.A. CityBES: A Web-based Platform to Support City-Scale Building Energy Efficiency, Urban Computing 2016, San Francisco.
- Gröger, G., Plümer, L. CityGML – Interoperable semantic 3D city models, ISPRS Journal of Photogrammetry and Remote Sensing, 71: 12–33, 2012.
Related Posts
 Be Careful When Speaking About Lead Pollution: The Good, The Bad, And The Ugly!
 Temperature Has A Significant Influence On The Production Of SMP-Based Dissolved Organic Nitrogen (DON) During Biological Processes
 Does The Arrow Of Time Apply To Quantum Systems?
 Labeled Periodic Table
 A “Twist” In Wavefunction With Ultrafast Vortex Electron Beams
 Chemical And Biological Characterization Spot The Faith Of Nanoparticles