


The Hurst phenomenon is a behavior observed in geophysical processes in which wet or dry years are clustered during long time periods. A common practice for evaluating the presence of the Hurst phenomenon is to model the geophysical time series with the Hurst-Kolmogorov process (HKp, also called fractional Gaussian noise, fGn) and estimate its Hurst parameter H where high values of H indicate a strong presence of the Hurst phenomenon.
The estimation of H is of great importance in engineering practices because the uncertainty increases substantially when H is high. Furthermore, due to the increase in uncertainty, observed trends in data, even if they seem significant using classical statistical testing, can be insignificant under the LRD assumption.
The nature of the Hurst phenomenon remains an unsolved problem, although many explanations have been offered. Relevant questions suggest the presence of a universal Hurst parameter, its relationship with geophysical variables, and many more. Some explanations are based on the analysis of big geophysical datasets.
The examination of a big dataset of mean annual precipitation instrumental data which span from 1916-2015 from 1,535 stations which cover mainly Europe, Oceania, and North America (Figure 1) revealed that the median of the estimated Hurst parameters is equal to 0.56, indicating a weak presence of the Hurst phenomenon.
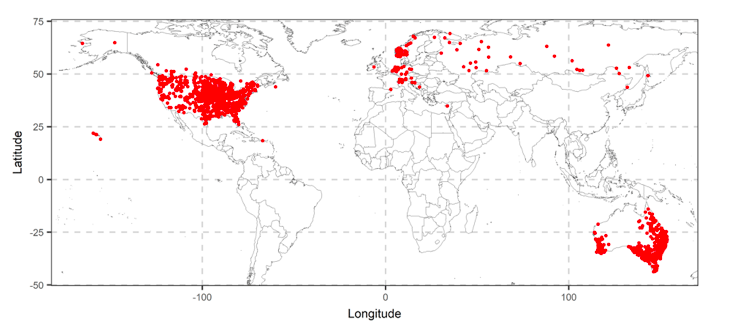
Figure 1. Map of locations for the 1,535 stations used in the analysis. Source: Tyralis et al .(2018)
The results also indicated that the Hurst parameter is mostly location-dependent, and a spatial model based on random forests can improve its predictability in unobserved locations. The application of the spatial model resulted in maps of the Hurst parameter, which indicate significant spatial clustering (for instance the contiguous US map is presented in Figure 2).
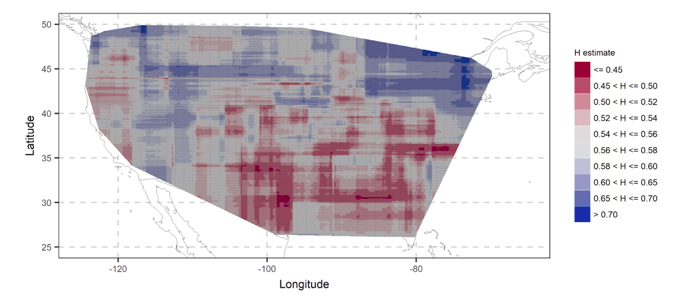
Figure 2. Heatmap of the Hurst parameter in the contiguous US. Source: Tyralis et al .(2018)
The estimated median value of the precipitation trends observed from the same dataset was equal to 0.36 mm/year, i.e., in the last 100 years, an increase in the annual precipitation of 36 mm was observed (see Figure 3). For comparison with the mean precipitation values, the median annual precipitation is equal to 718 mm.
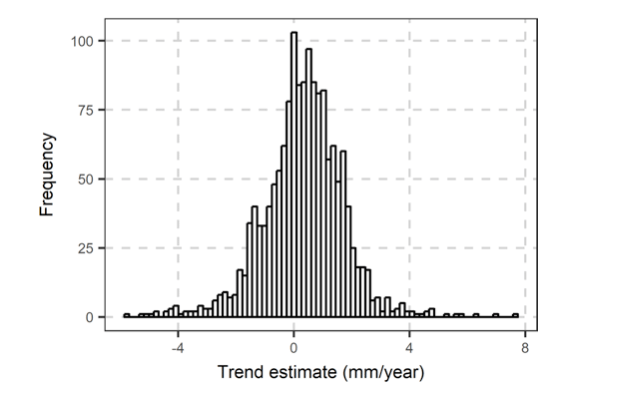
Figure 3. Histogram of trends based on the dataset of the 1,535 stations. Source: Tyralis et al .(2018)
The significance of the trends at a significance level α = 0.05 was examined by considering the presence of the Hurts phenomenon. The insignificant trends were approximately 50% of the stations, for main climate types A (equatorial), B (arid), C (warm temperate), and D (snow) according to the Köppen-Geiger classification. However, the percentage of stations with positive significant trends is higher than the percentage of negative significant trends for main climate type D and E (polar), while the percentages are equal for main climate types A, B, and C (see Figure 4).
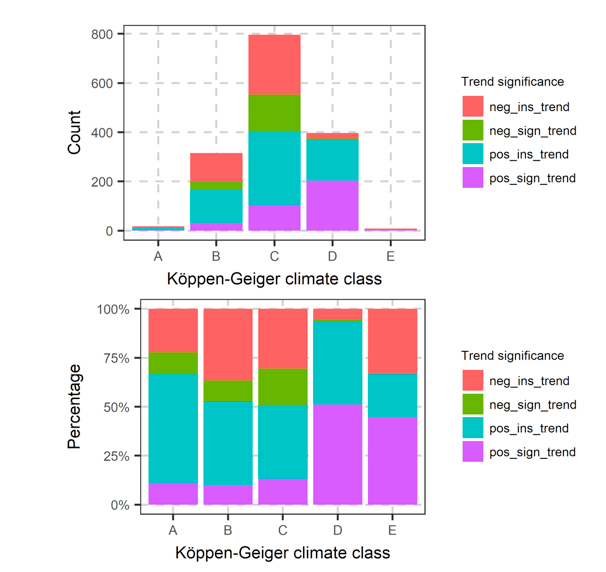
Figure 4. Number of stations with their trend significance (top) and percentages of stations for each type of trend significance (bottom) in each Köppen-Geiger climate class. The legend presents the sign of the trend (pos for positive and neg for negative) and its significance (sign for significant and ins for insignificant). Source: Tyralis et al .(2018)
These findings are described in the article entitled On the long-range dependence properties of annual precipitation using a global network of instrumental measurements, recently published in the journal Advances in Water Resources. This work was led by Hristos Tyralis from the National Technical University of Athens.
Related Posts
 Duck-Billed Dinosaurs Uncovered In Aniakchak, Alaska
 Cryptic Diversity In Vietnam’s Limestone Karst Habitats
 An Improved Method To Remove Debris From Cyst Nematode Egg Suspensions And Computer-Aided Technologies For Egg Counting
 The Footprints Of Urbanization, Industrialization, And Agriculture On River Beds: Heavy Metal Contamination Assessment And Source Identification In River Sediments In Eastern China
 Aging Dolphins Via Pectoral Flipper Radiography
 Glycoalkaloids In Potatoes: The Effect Of Biostimulants And Herbicides