


A pressure-temperature chart gives information on how the temperature and pressure of a substance are related to one another. Pressure and temperature have a relationship with one another, a relationship referred to as Gay-Lussac’s Law. Gay Lussac’s Law states that for a fixed mass of gas, the pressure of the gas has a directly proportional relationship with the temperature.
A closer look at how pressure and temperature are related to one another will help us understand the importance of Gay Lussac’s Law in chemistry and help us learn how to interpret a pressure-temperature chart, like one for r22 PT.
Gay Lussac’s Law
Gay-Lussac’s Law States that there is a relationship between the temperature in Kelvin of the gas and the pressure of the gas. Specifically, for any given amount of gas, if the volume is held constant, the pressure of that gas is directly proportional to its temperature in Kelvin. Another way of stating that is that as of the temperature goes up, the pressure also increases, and vice versa. This law can be represented by the following equation:
P / T = C
This law was discovered by the French chemist Joseph Gay-Lussac (1778 – 1850) who did experiments to quantify the relationship between pressure and temperature. As a concrete example of how this law works, think about how the operation of propane tanks is affected by temperature. If you ever cooked with a propane tank on a barbecue, perhaps you will have noticed that the tank’s pressure gauge registers higher on hot days than it does on cold days. You may have to take the variance in the pressure into consideration when deciding whether or not the tank can last for another cooking session.
As a more mathematical example of the relationship between pressure and temperature, consider how the temperature of gas in an aerosol can could change at different temperatures. If the pressure of the gas is 3 ATM when the temperature is 25°C (or 298° Kelvin) we can figure out the pressure of the can at 845°C or 1108 teen degrees Kelvin. We can use this equation to represent the difference:
P2 = (3.00atm×1118K)/298K = 11.3 atm
As you can see, the pressure increases substantially as the temperature of the aerosol can increases, which is why it is so dangerous to dispose of aerosol cans by burning them.
Exploring Charles’ Law
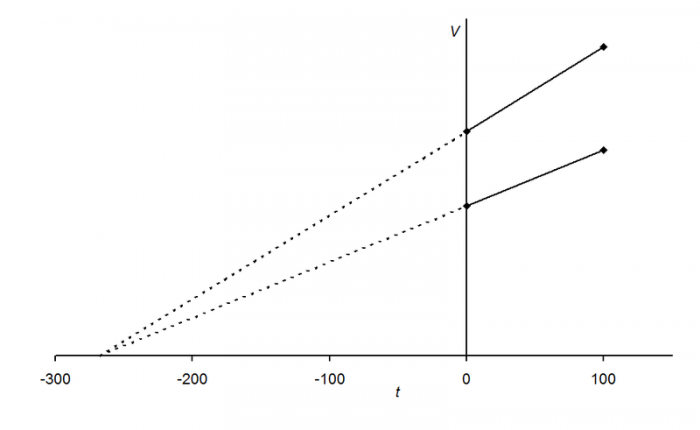
A representation of the relationship between volume and temperature, note how the two samples both decrease towards the same minimum point. Photo: Physchim62 via Wikimedia Commons, CC-BY 3.0
The Gay-Lussac Law is quite similar to another chemistry law called Charles’ Law. Charles’ law recognizes that there is a powerful relationship between the volume of the gas and the gas’ temperature. Consider how hot air rises, and how cool air tends to congregate at ground level. This is why the second story of your house is often a number of them ground-level and why hot air balloons rise. This is also why heating units are typically placed near the floor or on the floor, and conversely why air conditioning units are typically placed near the ceiling. The explanation for this phenomenon is that as gases are heated, they expand. Because the same amount of gas has been distributed across a larger surface area, this also means that cold air is denser than hot air.
The French chemist Jacques Alexandre César Charles (1746–1823) was the first person to do experiments quantifying this correlation between temperature and volume. By plotting the results of his experiments on a graph Charles was able to show that the relationship between temperature and volume is basically a straight line, that’s there a more or less linear relationship between the two attributes. Because there was a linear relationship, the straight line that tracked both the volume and temperature of a gas could be traced all the way down to some point where both volume and temperature should be essentially nonexistent, and this theoretical point corresponds to the temperature −273.15°C. Remember that this is just a theoretical value and that in reality, a sample of gas can’t have zero volume. Another point to consider is that at 1 atm every known gas will liquefy at temperatures far above that of −273.15°C.
Both Gay-Lussac’s finding and Charle’s law can be stated with simple equations, and the equation that represents Charles’ law is the following:
V=const.T
Avogadro’s Law

Photo: By The original uploader was Anton at German Wikipedia. – Transferred from de.wikipedia to Commons by Septembermorgen using CommonsHelper., Public Domain, https://commons.wikimedia.org/w/index.php?curid=8947961
Avogadro’s law, also referred to as Avogadro’s principal is another gas law covering how the volume of gas is related to the amount of substance within that gas. More formally, it states that equal volumes of different gases will all have the same number of molecules when at the same temperature and pressure. In other words, for any given mass of an ideal gas, assuming the pressure and temperature of the gas are constant, the number of moles in the volume of that gas will have a directly proportional relationship.
Avogadro’s law to be represented with the following equation:
V=const.(n)
More concretely, if you have four different samples of gases, let’s say hydrogen, nitrogen (N2), Nh3 and CH4, the four different gas samples will possess the same number of gaseous particles as long as the volumes are equivalent and they are at the same atmospheric pressure and temperature. Note that the mass of these four gases will be different though because the molar mass for each gas is different.
The principle or law is named after the Italian scientist Amedeo Avogadro. Avogadro was responsible for not only the above hypothesis, but Avogadro also played an important role in defining the mole unit of measurement. The number of molecules, or constituent particles, in an amount of substance equivalent to one mole is 6.022140857(74)×10^23. This is Avogadro’s number or the Avogadro constant. In May 2019 the International System of Units will redefine the value of the Avogadro constant as exactly 6.02214076×10²³ mol−1.
Boyle’s Law
Another gas law is Boyle’s law, which states that the volume of a gas will decrease as the pressure on a gas increases. This is because the pressure forces the particles in the gas towards one another. As an opposite effect, the volume of the gas will increase as the pressure decreases, because the gas particles are capable of moving further apart from one another. This effect is what is responsible for the fact that weather balloons increase in size as they rise from the atmosphere and transition to regions of low pressure. The decreased pressure in the upper atmosphere means the gas has more room to expand until the external and internal pressures are equalized.
Boyle’s Law is named after the Irish chemist Robert Boyle, who did some experiments in the middle of this 17th century that were responsible for quantifying the relationship between the volume of a gas and the pressure that the gas was under. In order to explore this relationship, Boyle employed a J-shaped tube that was partially filled with mercury. The structure of the tube and the mercury within it trapped a small amount of gas within the tube and Boyle measured how the volume of the gas changed when it was under different pressures.
The relationship between pressure and volume can be expressed by the following equation:
V = const./P = const.(1/P)
The Combined Gas Law
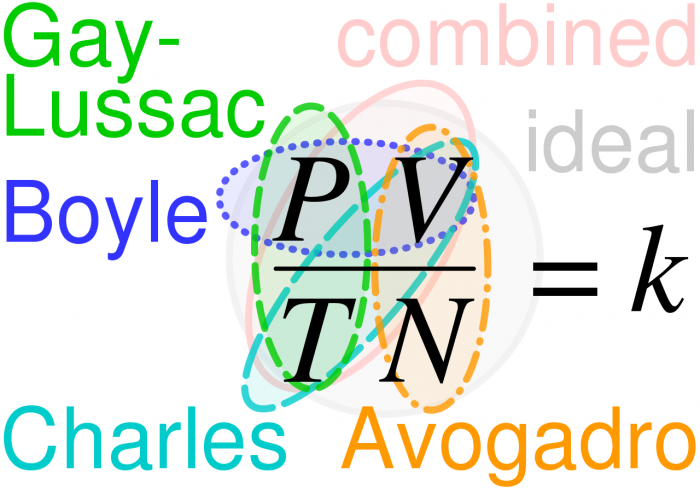
The relationships between the ideal gas laws. Photo: By Cmglee – Own work, CC BY-SA 4.0, https://commons.wikimedia.org/w/index.php?curid=75987024
The combined gas law is a general gas equation that results from combining the above laws together, showing how the values of pressure, volume, and temperature are related to one another. For any fixed mass of gas, the relationship between its components can be expressed like this:
P1V1/T1 = p2V2/T2.
Adding Avogadro’s Law into this equation gives us this:
This is the Ideal Gas Law.
Beyond this, there are other gas laws such as grams law, Dalton law, and Henry’s law, but these other laws aren’t used as frequently as the above four laws.
Interpreting A Pressure Temperature Chart
Now that we have seen the various laws that cover the different attributes of gases, pressure, and temperature included, we can better understand how to interpret a pressure-temperature chart. A pressure-temperature chart, like this one, includes values for both the temperature and pressure of a gas or fluid across a series of rows and columns.
The columns are on one axis while the rows are on the other axis. Examining one row or column of the chart will show that as the temperature increases the pressure of the liquid or gas should increase as well, in accordance with the laws defined above. If you are curious about the specific pressure that a gas or liquid has at a specific temperature just look for that temperature and follow the row across to find the temperature or pressure, or vice versa.
Related Posts
 Be Careful When Speaking About Lead Pollution: The Good, The Bad, And The Ugly!
 Temperature Has A Significant Influence On The Production Of SMP-Based Dissolved Organic Nitrogen (DON) During Biological Processes
 Does The Arrow Of Time Apply To Quantum Systems?
 Labeled Periodic Table
 A “Twist” In Wavefunction With Ultrafast Vortex Electron Beams
 Chemical And Biological Characterization Spot The Faith Of Nanoparticles