


Petroleum use in the United States (U.S.) in 2016 was 5 percent lower than in 2005, and imports declined by 26 percent over the same period. Still, petroleum continues to account for 92 percent of all transportation fuels in the U.S.
Oil market shocks, arising from conflicts in the world’s oil-producing regions and transportation areas, direct attacks on oil supply infrastructure, changes in global economic activity, extra-market actions by oil producers, oil production, and transportation accidents, and natural events, such as hurricanes, often lead to sustained changes in global oil prices. Estimates of potential economic damages from rapid and large increases in oil prices that follow severe oil market shocks are necessary to quantify costs and evaluate the potential benefits of alternative policy responses. However, the economic impacts of oil markets shocks are determined by a multitude of factors related to the nature and timing of the shock, economic conditions and policies at the time of the shock, and the evolving economic structure and institutions in a given economy.
Available empirical estimates of the economic impacts are usually summarized by the ratio of percentage change in gross domestic product (GDP) to a percentage change in oil price (the “GDP elasticity”). They vary widely due to the above shock and economy-related factors, as well as factors related to the data and empirical models used, and other sources of uncertainties.
We address the policy need for greater clarity on the GDP elasticity with respect to oil price (GDP elasticity) by synthesizing estimates from 18 recent studies of net oil importing nations using a formal meta-regression analysis (MRA) method. MRA is a well-established method that is commonly used to statistically synthesize economic parameters, such as price or income elasticity of demand for fuel or other goods, from the estimates of multiple studies. However, this is the first study to apply MRA to the GDP elasticity.
We use MRA to estimate the combined average and lower/upper bounds of the U.S. GDP elasticity. In addition, within the limits of data from the 18 studies, we examine the role of factors that affect estimates of the GDP elasticity, in five categories: (i) Type of model; (ii) Period (years) covered by the data; (iii) Size and duration of the oil price shock; (iv) Oil and other characteristics of the economy; (v) Drivers of oil price shocks (demand e.g. unexpectedly strong global economic growth/slowdown or supply e.g. oil production shut-in due to a hurricane).
While our focus is on estimates for the U.S., we include some recent non-U.S. studies to better understand the influence of these factors (see Fig. 1 for a summary of GDP elasticity estimates from the 18 studies). Most studies provide multiple estimates, for different time intervals after the shock onset, and for different regions.
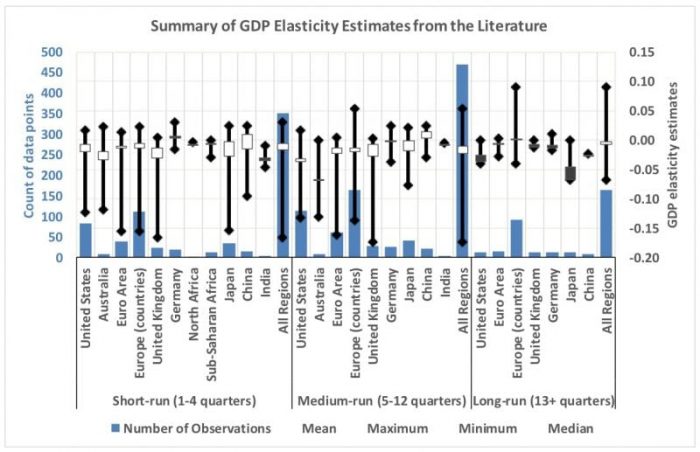
Republished with permission
Overall, we found that the recent oil-economy literature implies a negative average U.S. GDP elasticity with respect to oil prices (oil price increases reduce GDP), but with smaller magnitude than was commonly estimated a decade or more ago. Yet, despite the years of historical experience and research, the range of estimates remains wide; highlighting the important roles played by the above factors. Results indicate that regional variables, serving as a proxy for differences in the structure of the economy, modeling approaches, and the distinction between supply vs. demand drivers of shocks play a significant role in these elasticity estimates. We also found support for the notion that economic sensitivity to oil price shocks has declined since the 1970s but conclude that the prospective GDP losses following a large unanticipated supply disruption are still non-trivial.
Fig. 2 shows average estimates of the U.S. GDP elasticity from simulating our MRA model for 12 quarters following the onset of a shock, as well as the 1-standard deviation lower/upper bounds. The average U.S. estimate is negative over the 12 quarters, with the magnitude increasing from about 0.015 to 0.024. This implies that a 100% increase in oil prices due to an oil market shock could reduce U.S. GDP by about 2%. The 1-standard deviation interval over the 12 quarters is -0.038 to -0.001. Although these results depend on the available and accessible studies included in the analysis, this assessment supports an important need for an updated understanding of the potential macroeconomic costs of future oil shocks, and the value of policies to avoid those costs. The analysis can be updated as new studies become available to capture the evolving U.S. oil-economy relationship.
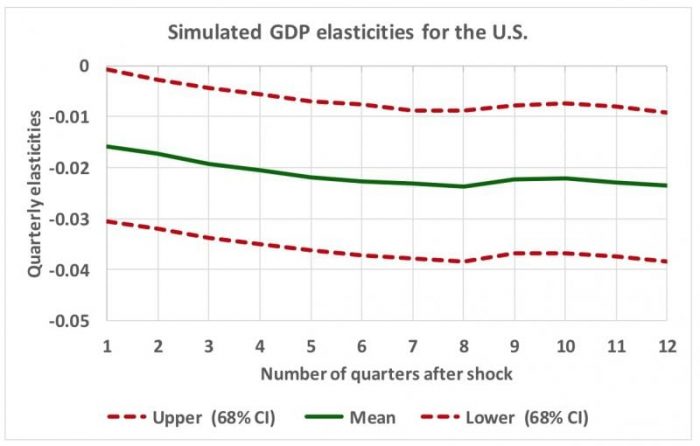
Republished with permission
These findings are described in the article entitled Impacts of oil price shocks on the United States economy: A meta-analysis of the oil price elasticity of GDP for net oil-importing economies, recently published in the journal Energy Policy.
This work was conducted by Gbadebo A. Oladosu, Paul N. Leiby, David C. Bowman, Rocio Uría-Martínez, and Megan M. Johnson of Oak Ridge National Laboratory (ORNL) and UT-Battelle under contract with the US Department of Energy. The opinions expressed herein are those of the authors and not necessarily those of their institutions.
Related Posts
 Duck-Billed Dinosaurs Uncovered In Aniakchak, Alaska
 Cryptic Diversity In Vietnam’s Limestone Karst Habitats
 An Improved Method To Remove Debris From Cyst Nematode Egg Suspensions And Computer-Aided Technologies For Egg Counting
 The Footprints Of Urbanization, Industrialization, And Agriculture On River Beds: Heavy Metal Contamination Assessment And Source Identification In River Sediments In Eastern China
 Aging Dolphins Via Pectoral Flipper Radiography
 Glycoalkaloids In Potatoes: The Effect Of Biostimulants And Herbicides