


The presence of soluble salts, such as sodium chloride, in agricultural soils can dramatically reduce crop yield. In irrigated agriculture, especially in arid and semi-arid areas, the buildup of salts in the soil profile is driven by several evapotranspiration processes that remove water from soil pores while leaving salts behind.
The accumulation of salts can be avoided by applying excess irrigation water, in such a way that salts are leached below the root-zone. However, irrigating in excess of crop requirements is increasingly contentious where water is scarce.
Globally, 40 percent of the total food is produced in irrigated farmland, which represents only 20 percent of the total cultivated land1. Although global salinity estimates are uncertain, the Food and Agriculture Organization indicates that about a fifth of the world’s irrigated farmland is affected by salinity. Over half of salt-affected irrigated soils are found in four countries: China, India, Pakistan, and the United States1. In irrigated soils, salinity generally accumulates within the soil profile and, less frequently, at the soil surface. Inventorying soil salinity at the state and continental levels are essential for identifying and understanding drivers and trends in soil salinity, understanding the economic impacts of this hazard2, and for developing mitigation strategies and management plans.
Mapping soil salinity over large areas is challenging because of its complex spatial variability. Remarkable gradients in salinity are often observed within individual agricultural fields because of the natural variability that exists in soil properties which affect water and salt movement through the soil. Across multiple fields, additional variations occur due to a variety of factors, including irrigation practices and water quality, agronomic practices, and soil tillage. Traditional soil surveys are unable to identify short-range variability in salinity because soil cores are obtained only every 1-1.5 km. Satellite imagery, on the other hand, is an ideal tool for capturing short-scale variability over very large regions.
In the past decade, several studies showed that it is possible to quantify the effect of salt stress on agricultural vegetation by monitoring crop growth with remote sensing at the regional scale. 3-5 Usually, multitemporal analysis of satellite vegetation measurements are needed to separate the effects of salinity on crops from the effects of other biotic and abiotic stressors. Different satellites and data-analysis approaches have been used to map soil salinity. For example, Scudiero et al. 6 used seven years of Landsat 7 imagery to map the root-zone soil salinity (i.e., salinity in the top 1.2 m of soil) across the western San Joaquin Valley in California, USA (Figure 1).
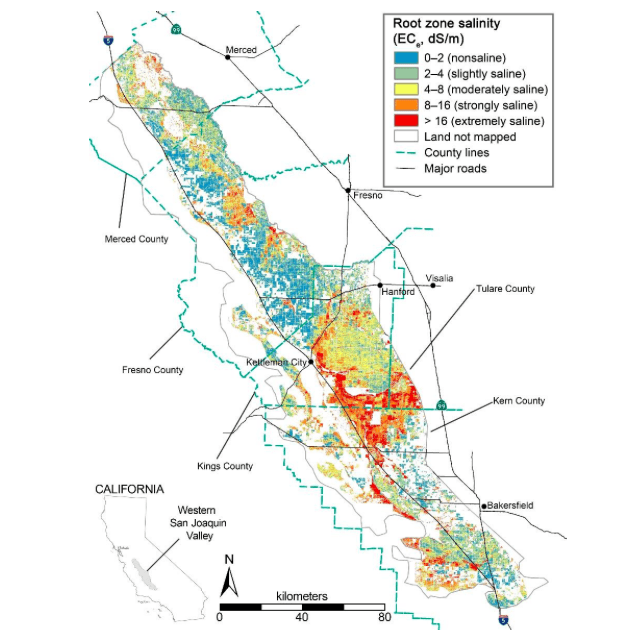
Figure 1. Remote-sensing map of root zone (0 to 1.2 m) soil salinity for farmland in the west side of the San Joaquin Valley, California, USA. Map by Scudiero et al. (2017). Credit: California Agriculture, University of California, Volume 71 Number 4, page 233. Copyright 2017, The Regents of the University of California.
Landsat 7 has a spatial resolution of 30×30 m and it collects imagery at the same location every 16 days. Zhang and colleagues 5 used 1-year of MODIS imagery for assessing root-zone soil salinity in the Yellow River Delta, China. MODIS vegetation monitoring is at 250 and 500 m resolution. Daily time-series can be obtained from MODIS imagery. Daily data can capture vegetation growth dynamics than are not observable with less frequent data, such as that from Landsat 7.
Future research efforts should focus on mapping and monitoring soil salinity at the continental and global scales. The interaction of different crops with soil (salinity) changes across the globe, because of several influencing factors, including weather. Mapping salinity at such broad scales would entail using remote sensing over diverse geographical regions. As a step towards that goal, the current remote sensing approaches proposed in the scientific literature should be tested and validated over different geographical and climatic regions of the world.
In the recent article “Validating the use of MODIS time series for salinity assessment over agricultural soils in California, USA,” published in the journal Ecological Indicators, we tested the MODIS time-series approach proposed by Zhang and colleagues 5 using a ground-truth soil salinity dataset from the western San Joaquin Valley. The western San Joaquin Valley is semi-arid farmland characterized by hot and dry summers and cool winters, whereas the Yellow River Delta, where Zhang and colleagues conducted their research, has humid continental and humid subtropical climates with dry winters and rainy summers. Vegetation “greenness” can be monitored using several indices calculated from MODIS imagery. In our study, we calculated the normalized difference vegetation index (NDVI), the enhanced vegetation index (EVI), and the Canopy Response Salinity Index (CRSI). The NDVI and EVI were also tested by Zhang and colleagues. The CRSI was developed by the USDA-ARS U.S. Salinity Laboratory 7.
Our research showed that the methodology proposed by Zhang and colleagues delivered accurate soil salinity estimates for soils in a climatic region that was different from the one previously investigated. However, we found that the vegetation indices have varying performances in the different regions. In the Yellow River Delta, EVI was better than NDVI for salinity mapping; in California, CRSI was better than NDVI, which was better than EVI. We improved the original methodology proposed by Zhang et al. by using multiple-year data instead of data from a single year; information from multiple growing seasons is needed to isolate the effect of salinity from other stresses. Finally, we noted that the spatial resolution of MODIS is not ideal for salinity assessment over California farmland: agricultural fields are often smaller than the MODIS pixels, and higher resolution remote sensing data are needed to address short-scale variations in soil patterns, land use, and other factors. We invite fellow scientists to further evaluate and harmonize different remote sensing methodologies so that we can obtain accurate (and much needed!) global inventories of agricultural soil salinity.
These findings are described in the article entitled Validating the use of MODIS time series for salinity assessment over agricultural soils in California, USA, recently published in the journal Ecological Indicators. The research summarized above was conducted (ordered by affiliation) by Mohamed Allali, Hesham M El-Askary, and Kristen Whitney from Chapman University, by Dennis L Corwin and Todd H Skaggs from the USDA-ARS U.S. Salinity Laboratory, and by Elia Scudiero from the University of California Riverside and the USDA-ARS U.S. Salinity Laboratory.
References:
- FAO ITPS (2015). Status of the World’s Soil Resources (SWSR). Main Report, Food and Agriculture Organization of the United Nations and Intergovernmental Technical Panel on Soils, Rome, Italy.
- Welle, P. D., & Mauter, M. S. (2017). High-resolution model for estimating the economic and policy implications of agricultural soil salinization in California. Environmental Research Letters, 12(9). doi: 10.1088/1748-9326/aa848e
- Scudiero, E., Corwin, D. L., and Skaggs, T. H. (2015). Regional-scale soil salinity assessment using Landsat ETM+ canopy reflectance. Remote Sens. Environ. 169, 335–343. doi: 10.1016/j.rse.2015.08.026
- Wu, W., Al-Shafie, W., Mhaimeed, A., Ziadat, F., Nangia, V., and Payne, W. (2014). Soil salinity mapping by multiscale remote sensing in Mesopotamia, Iraq. IEEE J. Sel. Top. Appl. 7, 4442–4452. doi: 10.1109/jstars.2014.2360411
- Zhang, T., Qi, J., Gao, Y., Ouyang, Z., Zeng, S., and Zhao, B. (2015). Detecting soil salinity with MODIS time series VI data. Ecol. Indic. 52, 480–489. doi: 10.1016/j.ecolind.2015.01.004
- Scudiero, E., Corwin, D. L., Anderson, R. G., Yemoto, K., Clary, W., Wang, Z. L., & Skaggs, T. H. (2017). Remote sensing is a viable tool for mapping soil salinity in agricultural lands. California Agriculture, 71(4), 231-238. doi: 10.3733/ca.2017a0009
- Scudiero, E., Skaggs, T. H., & Corwin, D. L. (2014). Regional scale soil salinity evaluation using Landsat 7, western San Joaquin Valley, California, USA. Geoderma Regional, 2-3, 82-90. doi: 10.1016/j.geodrs.2014.10.004
Related Posts
 Duck-Billed Dinosaurs Uncovered In Aniakchak, Alaska
 Cryptic Diversity In Vietnam’s Limestone Karst Habitats
 An Improved Method To Remove Debris From Cyst Nematode Egg Suspensions And Computer-Aided Technologies For Egg Counting
 The Footprints Of Urbanization, Industrialization, And Agriculture On River Beds: Heavy Metal Contamination Assessment And Source Identification In River Sediments In Eastern China
 Aging Dolphins Via Pectoral Flipper Radiography
 Glycoalkaloids In Potatoes: The Effect Of Biostimulants And Herbicides