


In the context of smart grids, the quantification of the energy potential of Distributed Energy Resources (DER), such as Demand Response (DR) and Photovoltaic Distributed Generation (PVDG) in electrical systems, allow them to be integrated into a sustainable energy planning as Demand Side Resources (DER), thus bringing new options and showing trends to utility planners and policymakers.
Price-based DR is related to the adoption of tariff schemes for end users in which higher electricity prices during system peak hours or contingencies stimulate consumers to reduce demand, frequently by means of a shift in the consumption to lower price hours [1] [3]. The cost reduction of Photovoltaic (PV) technology in recent years [2] and the environmental goals lead up to an expansion in the use of PVDG systems. The energy potential of PVDG and its impact on distribution networks must be evaluated for utility planning.
A case study in the state of São Paulo, Brazil, involving the adoption of an optional Time-of-Use (TOU) tariff called white tariff and/ or PVDG by a group of 270 households, designated as responsive consumers, from a total of approximately 1200 consumers connected to an electric distribution feeder (see Fig. 1), evaluated the potential of DR and PVDG for reduction in system peak demand, energy consumption from the grid, and distribution system technical losses [3].
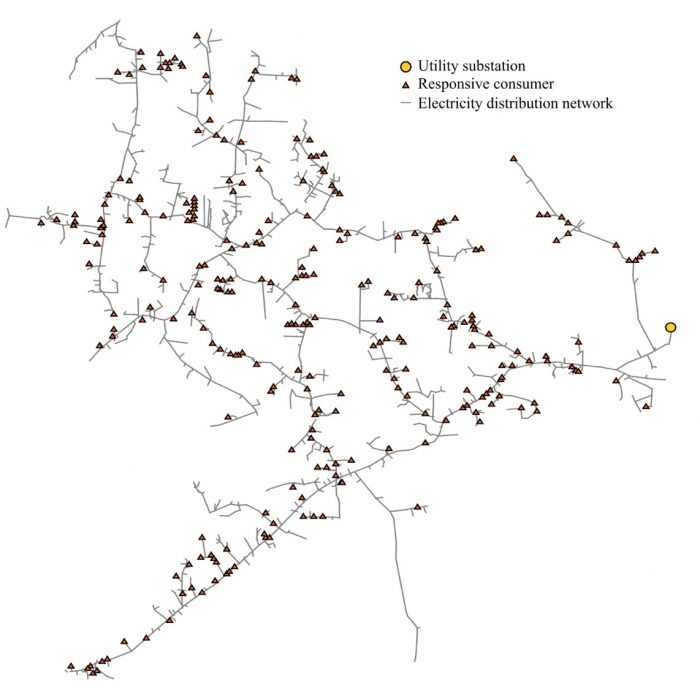
Fig. 1. Positioning of the responsive consumers and substation (Image credit: Matheus Sabino Viana)
Typical daily curves of consumers’ demand in per unit (p.u.), Plane-of-Array (POA) irradiance, and PV panel temperature curves based on data from the case study region were used to perform simulations during a typical weekday with a temporal resolution of 30 minutes. The standard deviation values of each typical daily curve were available and have been used to perform a sensitivity analysis for the case study.
The number of responsive consumers was defined based on a survey performed by the electric utility in the case study region. The case study was composed of a base case without DR and PVDG (Scenario 1) and Scenarios 2-9 in which the group of responsive consumers adopted two different levels of DR and/or PVDG (see Fig. 2).
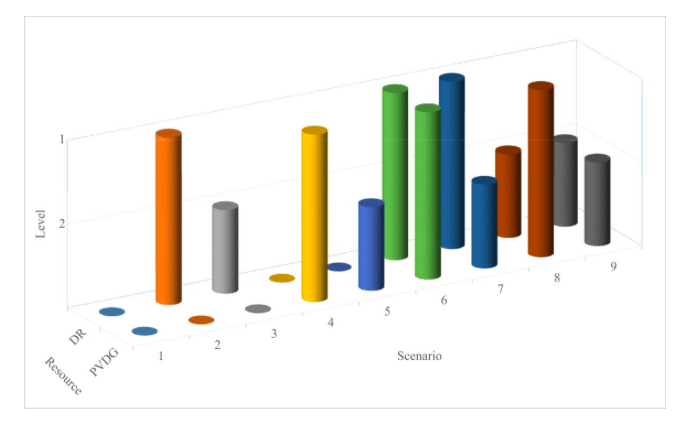
Fig. 2. Simulation scenarios with different levels of DR and/or PVDG for the responsive consumers (Image credit: Matheus Sabino Viana)
The TOU tariff adopted by the responsive consumers in scenarios with DR (see Fig. 3) presented the highest price on weekday peak hours from 19:00 to 21:59. The energy price on public holidays and weekend was equal to the off-peak hour’s price. The DR levels were defined based on different demand price elasticity coefficients estimated in [4]: -0.34 for level 1 and -0.16 for level 2, which resulted in responsive consumer approximately 20% and 10% peak demand reduction, respectively, compared to the base case [3].
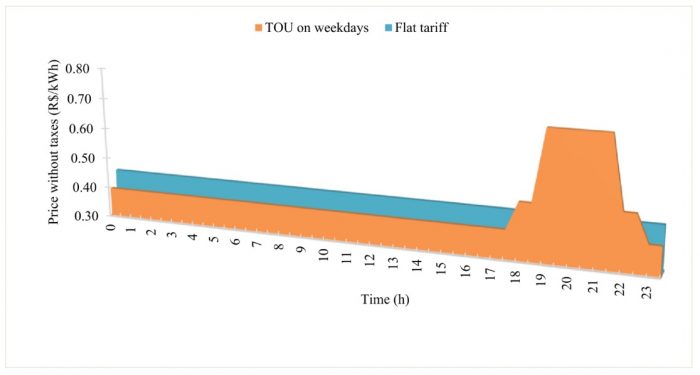
Fig. 3. Comparison of TOU tariff and a flat tariff on weekdays (Image credit: Matheus Sabino Viana)
In the applicable scenarios, the photovoltaic (PV) system for each responsive consumer was sized to not exceed the rated capacity of consumer electrical installation, and the daily energy consumed by the consumer was greater than the daily energy produced by the PV system. Two levels of PVDG were defined as follows: level 1 corresponded to the mean POA irradiance and PV panel temperature curves in December (with the highest energy production of the year), and level 2 corresponded to the mean POA irradiance and PV panel temperature curves in June (with the lowest energy production of the year) [3].
The greatest reduction in substation peak demand and system maximum power losses were approximately 6% and 11%, respectively, and occurred in scenarios 2, 6 and 7 with the highest level of DR (see Fig. 4). The reduction in peak demand was due to the decrease in responsive consumers demand and the correspondent reduction in maximum distribution system power losses. PVDG did not contribute to the reduction in peak demand because there was no solar irradiation during the system peak price hours [3].
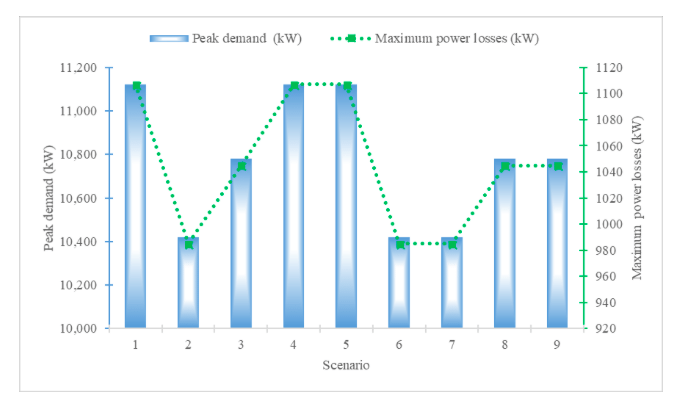
Fig. 4. Substation peak demand and maximum distribution system power losses (Image credit: Matheus Sabino Viana)
The greatest reduction in substation energy consumption was approximately 9% and occurred in scenarios 4, 6 and 8 with the highest level of PVDG (see Fig. 5). The reduction in substation energy consumption was due to the partial supplying of energy by responsive consumers’ PV systems and the correspondent reduction in distribution system energy losses. The greatest reduction in distribution system energy losses was approximately 13% and occurred in scenario 6 with the highest levels of DR and PVDG [3].
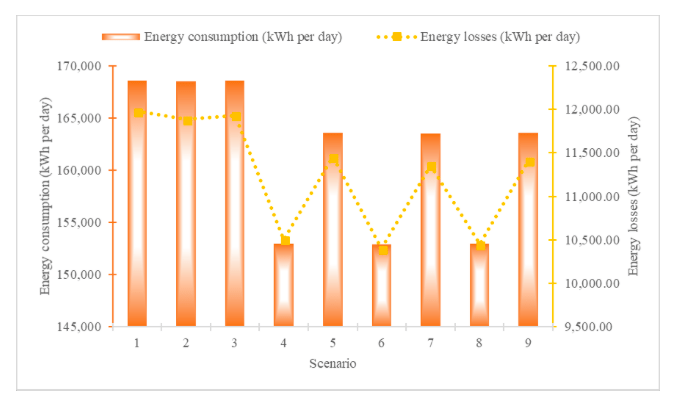
Fig. 5. Substation energy consumption and distribution system energy losses (Image credit: Matheus Sabino Viana)
The greatest energy bill saving of a responsive consumer sample with a maximum demand of 9.73 kW, calculated as a weighted-average in a typical Brazilian year, was approximately 36% and occurred in scenario 4 with the highest level of PVDG (see Fig. 6). The bill saving in scenario 6 with the highest levels of DR and PVDG was approximately 35%, indicating that simultaneous adoption of the white tariff and PVDG may not be economically attractive to consumers [3].
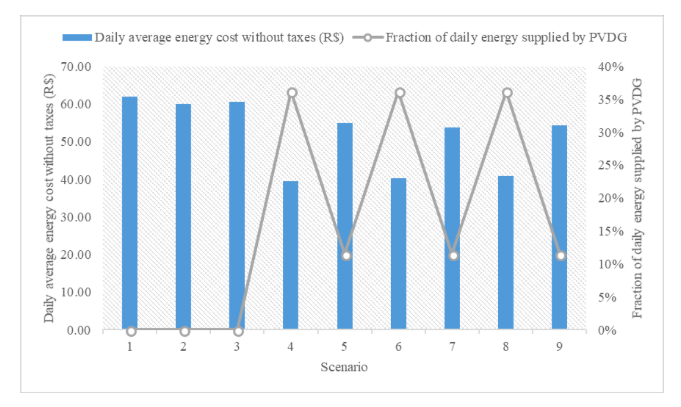
Fig. 6. Consumer average energy cost and the fraction of energy supplied by PVDG (Image credit: Matheus Sabino Viana)
To present a sensitivity analysis for the case study using a statistical method, a series of 100 simulations adding random variability to the demand curve of all consumers and to the POA irradiance and PV panel temperature curves in the applicable scenarios was performed. A random number with zero mean and variance of 1, multiplied by 20% of the standard deviation value of the curve was added to its original mean value (see the example in Fig. 7) [3].
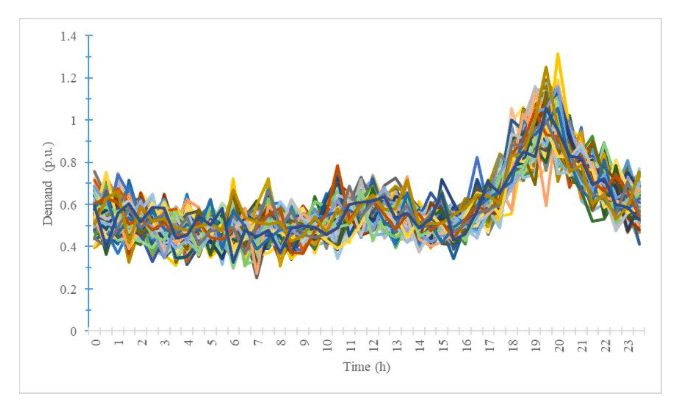
Fig. 7. Series of 100 load curves of a residential consumer sample with random variability for statistical analysis (Image credit: Matheus Sabino Viana)
The mean and standard deviation results of substation peak demand and energy consumption obtained through statistical analysis are presented in Figs. 8 and 9.
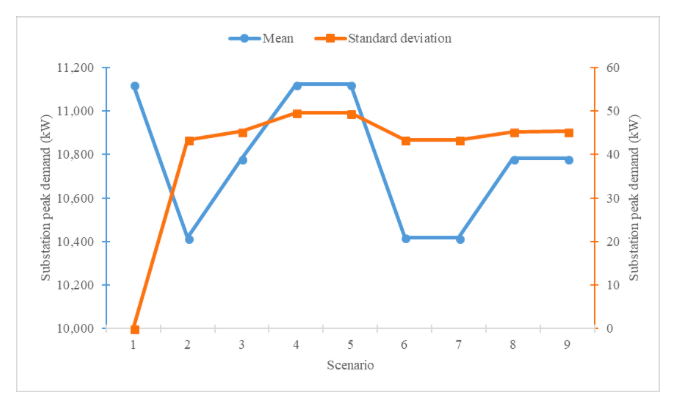
Fig. 8. Substation peak mean and standard deviation in a series of random simulations (Image credit: Matheus Sabino Viana)
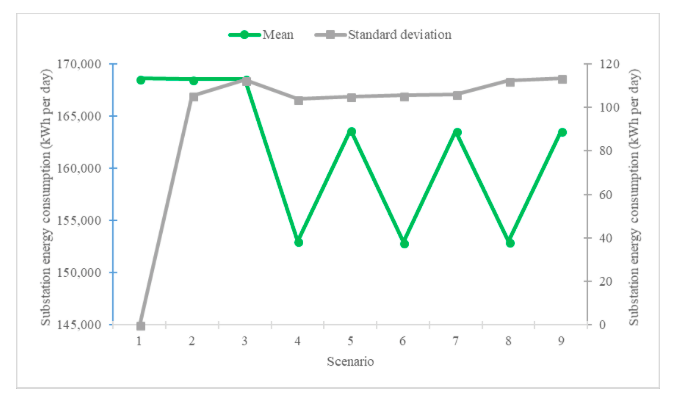
Fig. 9. Substation energy consumption mean and standard deviation in a series of random simulations (Image credit: Matheus Sabino Viana)
Resources such as DR and PVDG can permit postponing of investments in the expansion of the electrical system, increase the participation of renewable sources in electricity generation and improve the electrical network energy efficiency and energy conservation. Policymaking must consider alternatives to the optional white tariff to stimulate the simultaneous use of DR and PVDG [3].
These findings are described in the article entitled Analysis of demand response and photovoltaic distributed generation as resources for power utility planning, recently published in Applied Energy. This work was conducted by Matheus Sabino Viana, Giovanni Manassero Junior and Miguel E. M. Udaeta from the University of São Paulo.
References:
- R. Deng, Z. Yang, M. Y. Chow, and J. Chen, “A survey on demand response in smart grids: Mathematical models and approaches,” IEEE Trans. Ind. Informatics, vol. 11, no. 3, pp. 570–582, 2015.
- H. C. Gils, “Economic potential for future demand response in Germany – Modeling approach and case study,” Appl. Energy, vol. 162, pp. 401–415, 2016.
- M. S. Viana, G. Manassero, and M. E. M. Udaeta, “Analysis of demand response and photovoltaic distributed generation as resources for power utility planning,” Appl. Energy, vol. 217, no. May 2018, pp. 456–466, 2018.
- L. Hollanda, “Essays on Economic Regulation. A Microdata Approach to Household Electricity Demand in Brazil,” Fundação Getúlio Vargas, 2012.
Related Posts
 Duck-Billed Dinosaurs Uncovered In Aniakchak, Alaska
 Cryptic Diversity In Vietnam’s Limestone Karst Habitats
 An Improved Method To Remove Debris From Cyst Nematode Egg Suspensions And Computer-Aided Technologies For Egg Counting
 The Footprints Of Urbanization, Industrialization, And Agriculture On River Beds: Heavy Metal Contamination Assessment And Source Identification In River Sediments In Eastern China
 Aging Dolphins Via Pectoral Flipper Radiography
 Glycoalkaloids In Potatoes: The Effect Of Biostimulants And Herbicides