Temperature anomalies, especially temperature extremes, have received increasing attention due to their potentially severe impacts on ecosystems, economy, and human health. The impacts of historical and potential future temperature anomalies are regionally and even locally specific. In order to understand the regional characteristics of temperature anomalies and meet the needs of managing the human settlement environment, Yang’s research group specifically present a three-stage hybrid model in facilitating regional-scale temperature anomalies assessments [1].
Clustering is a process of partitioning a set of data into a set of meaningful groups, called clusters. K-means clustering algorithm is one of the simplest unsupervised learning algorithms that can partition data into K non-overlapping regions. In regionalization of temperature anomalies by cluster analysis, stations with similar temperature characteristics are grouped together to form a cluster. But its reliability is unduly influenced by the initial cluster centers and cluster numbers. To reduce uncertainty and facilitate objectivity during regionalization, the cluster numbers and centers of the clusters were chosen a priori using the empirical orthogonal function (EOF) and rotated empirical orthogonal function (REOF) analysis respectively in this paper. Based on the objective regionalization, a three-stage hybrid model was developed.
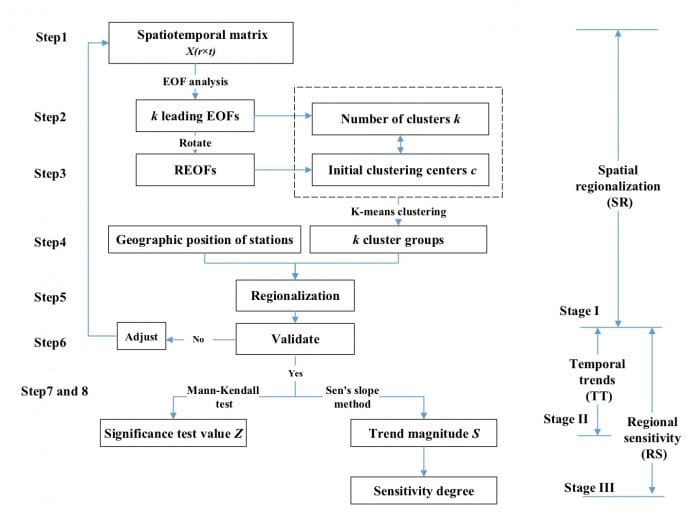
The stated goals of the three-stage hybrid model were to identify regionally coherent changes, analyze trends in subregions, and discover sensitive areas. It consisted of stages of spatial regionalization, temporal trends, and regional sensitivity analyses. The stage I model aimed to objectively identify subregions with coherent temperature changes using the EOF, REOF, and K-means clustering algorithm. After validating and adjusting for regionalization, the temporal trends in the subregions were analyzed by the Mann-Kendall test in the stage II model. A comparison of the temperature sensitivity among the subregions was conducted using Sen’s slope method in the stage III model.
The steps of the three-stage hybrid model are as follows: Step 1. Establish the spatiotemporal matrix X(r×t) for temperatures. Step 2. Determine the number of clusters k by EOF analysis. Step 3. Determine initial clustering centers c by REOF analysis. Step 4. Assign r stations into k cluster groups using the K-means clustering algorithm. Step 5. Identify the subregions based on the cluster groups and geographic position of the stations. Step 6. Validate the homogeneity within subregions and the heterogeneity between subregions. Step 7. Analyze temporal trends using the Mann-Kendall test. Step 8. Analyze the regional sensitivity using the Sen’s slope method.

Fig.1. Flowchart of a three-stage hybrid model with stages of spatial regionalization (SR), temporal trends (TT) and regional sensitivity (RS) analyses.
To sum up, this is a general and systematic model that may be applied to the spatial-temporal analyses in meteorological and hydrological fields. The paper analyzed annual mean and extreme temperatures using the daily data collected from 537 stations in China from 1966 to 2015, including the annual mean, minimum, and maximum temperatures (Tm, TNm, and TXm) as well as the extreme minimum and maximum temperatures (TNe and TXe). A combination of the EOF, REOF and K-means clustering analysis was employed to group 537 temperature stations into a small number of regions.
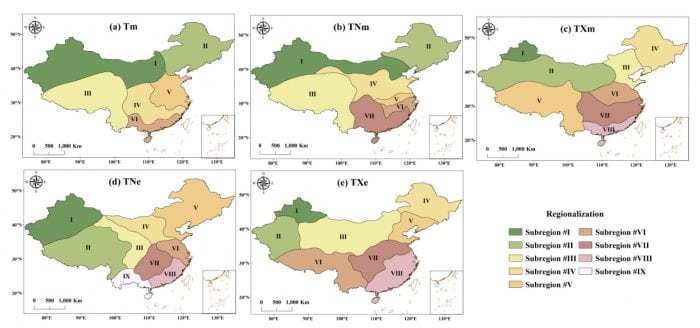
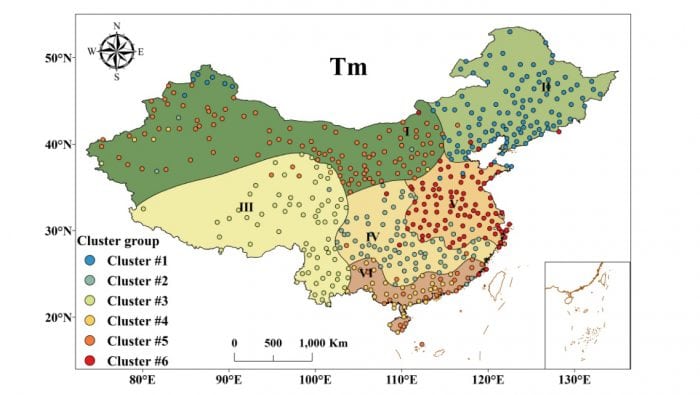
Fig. 2 illustrated the spatial regionalization of the mean and extreme temperature anomalies based on the stage I model. The numbers of subregions were 6, 7, 8, 9 and 8 for Tm, TNm, TXm, TNe, and TXe, respectively. Taking Tm as an example, China was divided into six subregions, including the Northwest, Northeast, Southwest, Central, East and South regions (Fig. 2a). The majority of stations in each subregion belonged to the same cluster group, indicating regionally coherent changes (Fig. 3). The resulting partition is such that each station in a region is more highly correlated with another station in the same region, than with stations in any other region.

Fig.2. Spatial regionalization of temperature anomalies.

Fig.3. Spatial regionalization of Tm. The color of each dot denotes the corresponding cluster group to which it belongs.
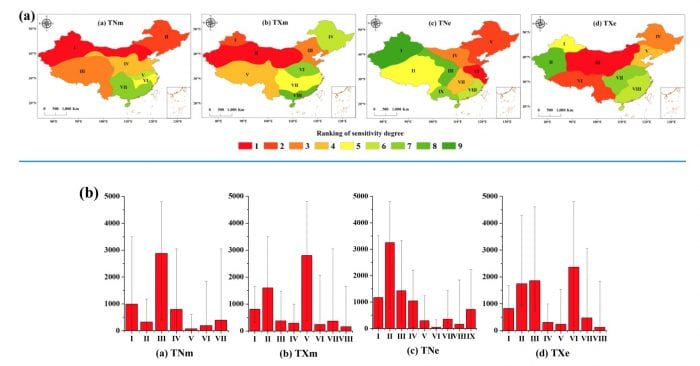
According to the trends and sensitivity analyses of regional temperature anomalies, the warming rates among subregions were greatly different, though significant increases in temperature were observed in most regions of China from 1966 to 2015. Fig. 4(a) depicted the sensitivity degree ranking of regional temperature anomalies. Fig. 4(b) presented the mean elevation and error bar of the elevation in each subregion.
From Fig.4, the maximum temperature increased significantly at high elevations, whereas the minimum temperature increased greatly at middle-low elevations. For example, the most sensitive areas in TNm and TNe were regions I and VI, with mean elevations of 991 m and 51 m, respectively. The warming trends in region II of TXm and region III of TXe were the most significant, with mean elevations of 1694 m and 2098 m, respectively.

Fig.4. (a) ranking of sensitivity degree of regional temperature anomalies. The scores that represent sensitivity degrees range from 1 to 9. The subregion with higher score possesses lower sensitivity degrees. (b) the mean elevation and error bar of the elevation in each subregion.
These findings are described in the article A three-stage hybrid model for regionalization, trends and sensitivity analyses of temperature anomalies in China from 1966 to 2015, recently published in the journal Atmospheric Research. This work was conducted by Dr. Feifei Wu, Prof. XiaoHua Yang and Prof. Zhenyao Shen from Beijing Normal University. We hope the three-stage hybrid model will be developed to solve the related human settlement environment problems for everyone.
Reference:
- F. F. Wu, X. H. Yang, Z.Y. Shen, A three-stage hybrid model for regionalization, trends and sensitivity analyses of temperature anomalies in China from 1966 to 2015, Atmospheric Research, 205(2018) 80-92.


