


Solar radiation at the Earth’s surface (SSR) is the primary source for life, as it controls various fields such as atmospheric environment, terrestrial ecosystems, and terrestrial climate. SSR is the most abundant renewable energy resource on Earth; nevertheless, it undergoes variations caused by changes in atmospheric constituents, cloud cover (percentage of the sky covered by clouds), and variations in the Sun-Earth geometry (distance from the Earth to the Sun). The third kind of variations is not of interest in this study as it is a purely astronomical (mathematical) issue.
The changes in SSR are short-term (intra-annual, seasonal) and long-term (decadal). The first category is due to the rotation of the Earth around the Sun, while the second is attributed to changes in the atmospheric composition and cloudiness (cloud cover). The multi-decadal variation in SSR over North America and Europe shows a decreasing tendency from the 1960s to late 1980s, a phenomenon called global dimming; this phenomenon has been attributed to the increasing levels of atmospheric pollutants over North America and Europe. Nevertheless, an increasing tendency in SSR levels has been identified over these regions in the period 1990-2000; this recovery in the SSR intensity has been called global brightening.
The solar radiation climate in a place refers to the levels and trends of the SSR components (i.e., the diffuse solar radiation, the radiation received from all parts of the sky apart from the Sun; the direct solar radiation, the radiation received from just the Sun; the global solar radiation, the sum of the diffuse and direct components). SSR is attenuated by clouds and atmospheric aerosols (suspended particles in the atmosphere such as air pollutants, volcanic ash, desert dust, marine spray). Clouds and atmospheric aerosols vary in space and time, thus causing analogous variations in SSR levels.
Data collection and analysis
For the analysis of the SSR levels, hourly values of the global solar radiation (Ge, units Wm-2) and diffuse solar radiation (De, units Wm-2) from the Actinometric Station of the National Observatory of Athens (ASNOA) in the period of 1992-2017 were used. Such measurements are still carried out by specific instruments called pyranometers.
Before any analysis, a quality-control test (QCT) was applied to the hourly values of both Ge and De data series. Those values not obeying the QCT criteria were rejected from further processing. The final Ge and De time series were deseasonalized (the effect of seasons on the time series was removed). In order to investigate the tendency in both the Ge and De series, the ITA (Innovative Trend Analysis) was applied to the deseasonalized data.
To apply the ITA method to a time series Zk (k=1, 2, …, n), in our case the Ge and De data, Z was divided into two equal halves Xi (i = 1, 2, … n/2), and Yj (j = n/2 +1, n/2 +2, …, n), with n being the number of the data values in the original Z time series. Next, the Xi and Yj subseries were sorted in ascending order; Xi was placed in the x-axis and Yj in the y-axis in the same graph (Fig. 1 shows an example). If both subseries do not possess any trend, their data lie on the 1:1 (45o) line; if there is a positive trend, the data are accumulated above the 1:1 line, whereas in a negative trend the data fall below the 1:1 line. If all the data are accumulated above or below the 1:1 line, the trend is said to be monotonic. If some data points lie above and others below the 1:1 line, then the trend is non-monotonic (i.e., different trends are present in the time series, see Figure 1).
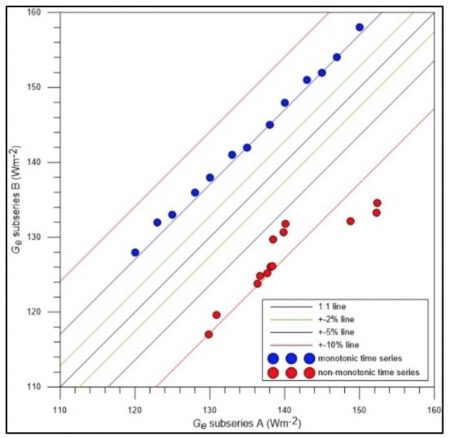
Figure 1. Example of monotonic and non-monotonic time series as determined by the ITA method.
To identify a trend in the time series the following trend indicator (D) was used in this work:

(1)
where xi and yi are data values of the Xi and Yj subseries, respectively, while x̄ is the arithmetic average of the Xi subseries.
In order to investigate the effect of cloudiness on SSR, the nebulosity index (F) was used in this work:

(2a)

(2b)

(2c)
where CR is the cloud ratio in real (measured) situations (CRM) and under (theoretical) clear-sky conditions (CRT); De,sci, the clear-sky diffuse irradiance, and Pe,sci, the theoretical direct horizontal irradiance, are given by the following relations:
(2d)
(2e)
All coefficients in Eq. (2d) are in Wm-2; m, TL, and αr are the relative optical mass, the extinction coefficient, the Linke turbidity factor, respectively; γ is the solar altitude (in deg):

(2f)

(2g)
(2h)
F varies between 0 and 1; Table 1 gives the 5 sky categories according to the values of the F index.
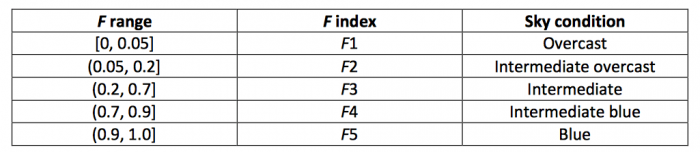
Table 1. Nebulosity index categories.
Results and discussion
Figure 2 shows the original and deseasonalized Ge and De annual data series. The fitted straight (blue dashed) lines have the expressions: Ge = 30.45+0.17year (3a) and De = 1682.07-0.77year (3b). By applying year=1992 and year=2001 (the two ends of the decade 1992-2001) to the Eq. (3a), taking the difference Ge2001–Ge1992, dividing the result by the average Ge value over the period 1992-2017 equal to 370.12 Wm-2 and multiplying it by 100%, a +0.41%/decade trend is found, implying a slight recovery (global brightening) in the SSR levels from their lower values of the 1950-1980 period. On the other hand, the trend of +0.41%/decade is equivalent to +0.15 Wm-2/year (or +1.50 Wm-2/decade). By repeating the calculations for the trend in the De time series in Eq. (3b), as for Ge, and taking into account that the average De value in the period of the study is 133.64 Wm-2, it is found that De has a trend of -5.19%/decade (or ≈-0.52%/year), implying a strong decreasing trend. This is equivalent to a decreasing tendency of -23 Wm-2/decade (or -2.30 Wm-2/year).
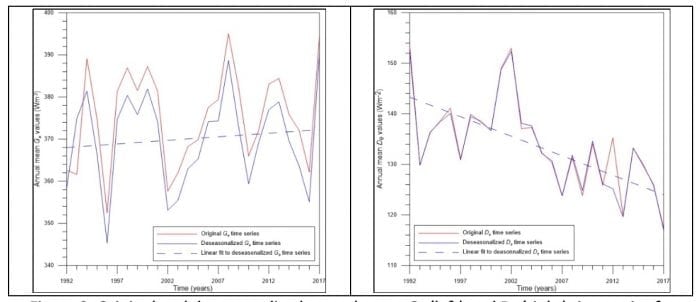
Figure 2. Original and deseasonalized annual mean Ge (left) and De (right) time series for Athens in the period 1992-2017 under all-sky conditions (all F categories).
The recovery of SSR levels after 1992 may be due to the various anti-pollution measures taken by the EU countries, including Greece. On the other hand, the decline in the diffuse radiation may be attributed to a reduction in cloudiness in the period of the study, as well as a decrease in the air pollution levels over Europe and aerosols loading over the Balkans.
Table 2 shows a comparison of the trend findings in this study to those in other relevant works as regards the Ge data. Comparison of the tendency of the De data in the present work with other studies is impossible as such data are not provided in the literature.
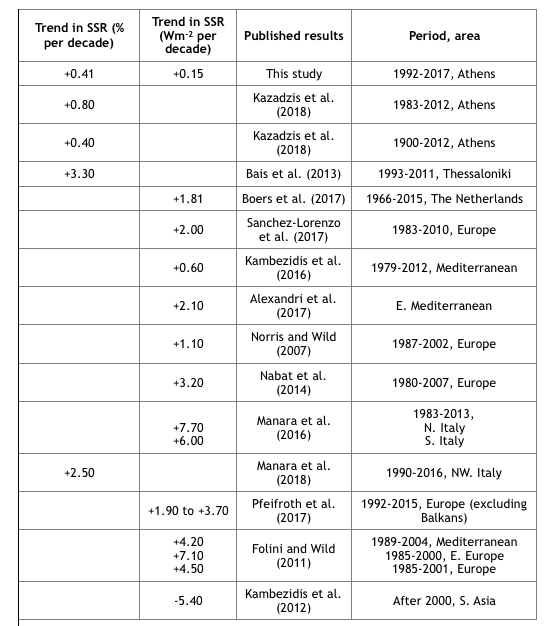
Table 2. Trends in SSR (Ge) under all-sky conditions from various works and periods.
Figure 3-left shows the ITA method for the monthly mean values of Ge, while Figure 3-right the individual D values calculated before the summation in Eq. (1). The overall D value (after the summation in Eq. 1) is +0.11, practically indicating no trend. The Ge time series is a non-monotonic one in the studied period as several data points are above and below the 1:1 line.
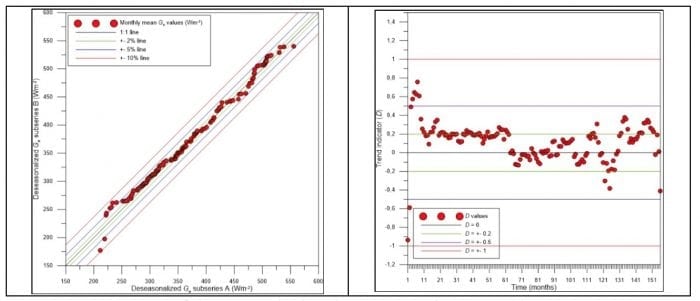
Figure 3. Application of the ITA method to the deseasonalized monthly mean Ge time series under all-sky conditions (all F categories). Left: subseries A vs. subseries B. Right: corresponding variation of D.
The application of the ITA method to the monthly mean De values and the corresponding diagram of the D values is shown in Figure 4. From the left graph of the Figure, it is seen that most of the data points of the De subseries A – De subseries B lie in the range [-10%, -5%] and some below the -10% line. The overall D value is -0.90, i.e., a significant negative trend.
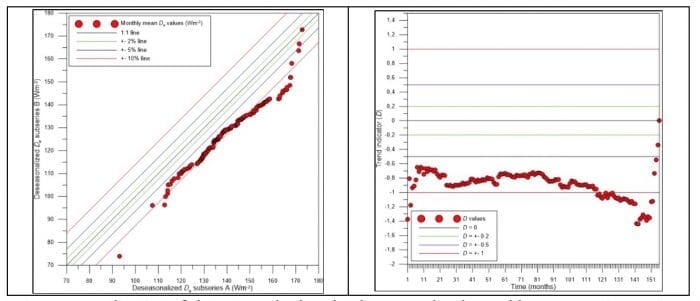
Figure 4. Application of the ITA method to the deseasonalized monthly mean De time series. Left: subseries A vs. subseries B. Right: corresponding variation of D.
The SSR time series for clear skies is shown in Figure 5. Here, the fitted straight (blue dashed) lines have the expressions: Ge = -1633.15+1.01year and De = 2210.76-1.03year. By applying year=1992 and year=2001 (the two ends of the decade 1992-2001) to the Eq. (3a), taking the difference Ge2001–Ge1992, dividing the result by the average Ge value over the period 1992-2017 equal to 382.21 Wm-2 and multiplying it by 100%, a +2.36%/decade trend is found, implying a remarkable recovery (global brightening) in the SSR levels from their lower values of the 1950-1980 period. On the other hand, the trend of +2.36%/decade is equivalent to ≈+0.91 Wm-2/year (or +9.09 Wm-2/decade). By repeating the calculations for the trend in the De time series in Eq. (3b), as for Ge, and taking into account that the average De value in the period of the study is 136.95 Wm-2, it was found that De has a trend of -6.77%/decade (or ≈-0.68%/year), implying a strong decreasing trend. This is equivalent to a decreasing tendency of -9.27 Wm-2/decade (or ≈-0.93 Wm-2/year).
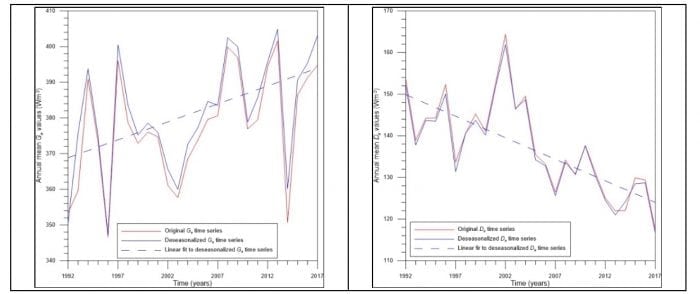
Figure 5. Original and deseasonalized annual mean Ge (left) and De (right) time series for Athens in the period 1992-2017 under clear-sky conditions (F5 category only).
Table 3 shows a comparison of the trend findings in this study to those in other relevant works as regards the Ge data. Comparison of the tendency of the De data in the present work with other studies is impossible as such data are not provided in the literature.
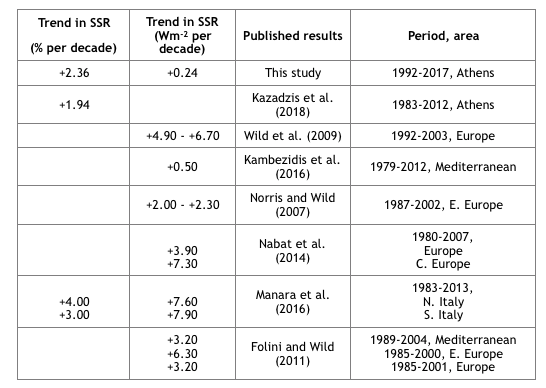
Table 3. Trends in SSR (Ge) under clear-sky conditions from various works and periods.
Figure 6-left shows the ITA method for the monthly mean clear-sky values of Ge, while Figure 6-right the corresponding D values calculated as mentioned in Section 2. The overall D value is +0.43, indicating a slightly positive trend. On the other hand, the application of the ITA method to the monthly mean De values and the corresponding diagram of the D values is shown in Figure 7. From the left graph of the figure it is seen that almost half of the data pairs of the De subseries A vs. De subseries B lie in the range [-10%, -5%], and the rest are below the -10% line (a similar result was obtained for the all-sky De trend in Fig. 4). This means that the diffuse radiation monthly values show significant/very significant negative trends in the period of the study. Indeed, the D diagram in Figure 7-right shows all its values to be accumulated in the range [-0.5, -1.0] as well as below the -1.0 line, thus confirming the above conclusion. This is in line with the overall D = -1.18 value (very significantly negative trend).
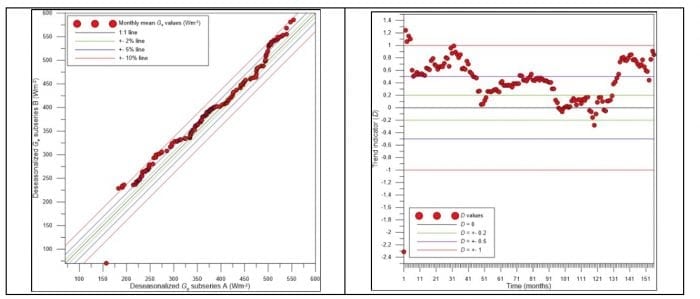
Figure 6. Application of the ITA method to the deseasonalized monthly mean Ge time series under clear-sky conditions (F5 category only). Left: subseries A vs. subseries B. Right: corresponding variation of D.
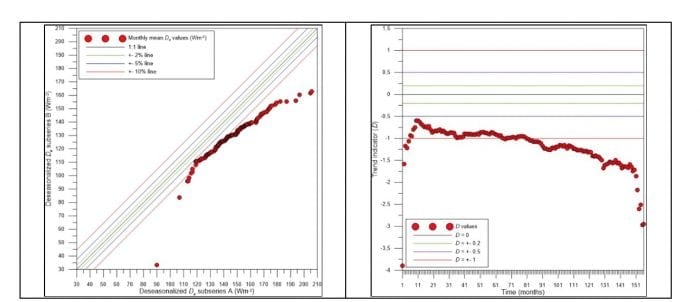
Figure 7. Application of the ITA method to the deseasonalized monthly mean De time series under clear-sky conditions (F5 category only). Left: subseries A vs. subseries B. Right: corresponding variation of D.
Conclusions
The present study investigated the variations and tendencies in SSR over Athens in the period 1992-2017, which can be characterized as the brightening era over most parts of Europe. This work incorporated several innovations: (i) for the first time, the ITA methodology was applied to climatological time series in Greece; (ii) for the first time worldwide, a diffuse solar radiation time series was included and examined in the scope of the solar radiation climatology at a place.
The ITA method was applied to both global and diffuse deseasonalized monthly mean values. The global radiation showed a non-monotonic trend over the period 1992-2017 under all-sky conditions (all F categories); nevertheless, the ITA analysis gave an overall trend of +0.11 (no trend). By applying a linear regression to the deseasonalized annual mean global radiation values, a +0.41%/decade (or +1.50 Wm-2/decade) trend was found. This result was compared with those from other similar studies conducted mainly over Europe in periods that include the one examined in this work.
The repetition of the ITA method to the deseasonalized monthly mean diffuse radiation values showed a non-monotonic variation over the period 1992-2017 with significant and very significant negative trends. Indeed, the overall trend indicator gave a value of -0.90 (significantly negative trend). The linear regression fit to the deseasonalized annual diffuse radiation time series gave a -5.19%/decade (or ≈-6.93 Wm-2/decade), a result that could not be compared with similar results as diffuse radiation analysis is almost non-existent in the international literature.
The ITA method for the monthly mean clear-sky (F5 category only) values of Ge showed a non-monotonic trend with an overall D = +0.43 (slightly positive trend). A linear fit to the deseasonalized Ge annual values gave a positive trend of +2.36%/decade (or +9.09 Wm-2/decade), a value comparable only with that of S. Italy (+7.90 Wm-2/decade). The repetition of the ITA method to the deseasonalized monthly mean De values showed a non-monotonic trend with D = -1.18 (very significantly negative trend). A linear fit to the deseasonalized annual mean De values gave a trend of -6.77%/decade (or -9.27 Wm-2/decade). This decline in diffuse radiation under clear skies over Athens after 1992 may be attributed to the decrease in air pollution and aerosol loading over the Balkans. As in the case of all skies, the present results of the diffuse radiation analysis could not be compared with others as such results are almost non-existent in the international literature.
These findings are described in the article entitled The solar radiation climate of Athens: Variations and tendencies in the period 1992–2017, the brightening era, recently published in the journal Solar Energy. This work was conducted by Harry Kambezidis from the National Observatory of Athens.
References:
- Alexandri, G., Georgoulias, A.K., Meleti, C., Balis, D., Kourtidis, K.A., Sanchez-Lorenzo, A., Trentmann, J., Zanis, P., 2017. A high-resolution satellite view of surface solar radiation over the climatically sensitive region of Eastern Mediterranean. Atmos. Res., 188, 107-121, doi:10.1016/j/atmosres.2016.12.015.
- Bais, A., Drosoglou, T., Meleti, C., Tourpali, K., Kouremeti, N., 2013. Canges in surface shortwave solar irradiance from 1993 to 2011 at Thessaloniki (Greece). Int. J. Climatol., 33, 2871-2876, doi:10.1002/joc.3636.
- Boers, R., Brandsma, T., Siebesma, A.P., 2017. Impact of aerosols and clouds on decadal trends in all radiation over Netherlands (1966-2015). Atmos. Chem. Phys., 17, 8081-8100, doi:10.5194/acp-17-8081-2017.
- Folini, D., Wild, M., 2011. Aerosol emissions and dimming/brightening in Europe: sensitivity studies with ECHAM5-HAM. J. Geophys. Res., 116, D21104, doi:10.1029/2011JD016227.
- Kambezidis, H.D., Kaskaoutis, D.G., Kharol, S.K., Moorthy, K.K., Satheesh, S.K., Kalapureddy, M.C.R., Badarinath, K.V.S., Sharma, A.R., Wild, M., 2012. Multi-decadal variation of the net downward shortwave radiation over south Asia: The solar dimming effect. Atmos. Environ., 50, 360-372.
- Kambezidis, H.D., Kaskaoutis, D.G., Kalliampakos, G.K., Rashki, A., Wild, M. 2016. The solar dimming/brightening effect over the Mediterranean basin in the period 1979-2012. J. Atmos. Solar-Terr. Phys., 150, 31-46.
- Kazadzis, S., Founda, D., Psiloglou, B.E., Kambezidis, H., Mihalopoulos, N., Sanchez-Lorenzo, A., Meleti, Ch., Raptis, P.I., Pierros, F., Nabat, P., 2018. Long-term series and trends in surface solar radiation in Athens, Greece. Atmos. Phys. Chem., 18, 2395-2411, doi:10.194/acp-18-2395-2018.
- Manara, V., Brunetti, M., Celozzi, A., Maugeri, M., Sanchez-Lorenzo, A., Wild, M., 2016. Detection of dimming/brightening in Italy from homogenized all-sky and c;lear-sky surface radiation records and underlying causes (1959-2013). Atmos. Chem. Phys., 16, 11145-11161, doi:10.5194/acp-16-11145-206.
- Manara, V., Bassi, M., Brunetti, M., Cagnazzi, B., Maugeri, M., 2018. 1990- 2016 surface solar radiation variability and trend over the Peidmont region (Northwest Italy). Theor. Appl. Climatol., published online on 31 May 2018, doi: 10.1007/s00704-018-2521-6.
- Nabat, P., Somot, S., Mallet, M., Sanchez-Lorenzo, A., Wild, M., 2014. Contribution of anthropogenic sulfate aerosols to the changing Euro-Mediterranean climate since 1980. Geophys. Res. Lett., 41, doi:10.1002/2014GL060798.
- Norris, J.R., Wild, M., 2007. Trends in aerosol radiative effects over Europe inferred from observed cloud cover, solar “dimming” and solar “brightening.” J. Geophys. Res., 112, D08214, doi:10.1029/2006JD007794.
- Pfeiforth, U., Kothe, S., Müller, R., Trentmann, J., Hollmann, R., Fuchs, P., Werscheck, M., 2017. Surface radiation data set – Heliostat (SARAH) – Edition 2. Sattelite Appl. Facility on Climate Monitoring, doi:10.5676/EUM_SAF_CM/SARAH/V002.
- Sanchez-Lorenzo, A., Enriquez-Alonso, A., Wild, M., 2017. Trends in downward surface solar radiation from satellites and ground observations over Europe during 1983-2010. Rem. Sens. Environ., 189, 108-117, doi:10.1016/j.rse.2016.11.018.
- Wild, M., Trüssel, B., Ohmura, A., Long, C.N., König-Langlo, G., Dutton, E.G., Tsvetkov, A., 2009. Global dimming and brightening: An update beyond 2000. J. Geophys. Res., 114, D00D13, doi:10.1029/2008JD011382.
Related Posts
 Duck-Billed Dinosaurs Uncovered In Aniakchak, Alaska
 Cryptic Diversity In Vietnam’s Limestone Karst Habitats
 An Improved Method To Remove Debris From Cyst Nematode Egg Suspensions And Computer-Aided Technologies For Egg Counting
 The Footprints Of Urbanization, Industrialization, And Agriculture On River Beds: Heavy Metal Contamination Assessment And Source Identification In River Sediments In Eastern China
 Aging Dolphins Via Pectoral Flipper Radiography
 Glycoalkaloids In Potatoes: The Effect Of Biostimulants And Herbicides