Suppose you colonized Mars. How would you do it? What would you do? … But we considered factors to determine potential colonization sites:
- Temperature
- The slope of the land
- The distance from craters
- The occurrence of sandstorms
To determine potential colonization sites we collected data on GIS software and combined various data like a raster, database, etc.
The first problem was the choice of the best projection, coordinate system. It turned out that NASA describes coordinate system. In GIS software we defined a new coordinate system based on Transverse Mercator Projection and we use it to our analysis.
The next stage was collect data. We were looking for the source of data, and we found products of NASA orbital mission (Mars Orbiter Laser Altimeter (MOLA) and Viking Mission to Mars), it was mainly raster data :
- The Digital Terrain Model
- Place of the occurrence of sandstorms
- Temperature
We added a database with craters, volcanoes, canyons, geographic regions and landing sites of Mars rovers.
Based on those data we defined criteria of analysis factors. During the analysis we identified the following criteria related to the possibility of settling on Mars:
- Temperatures ranging from – 30 °C to 30 °C
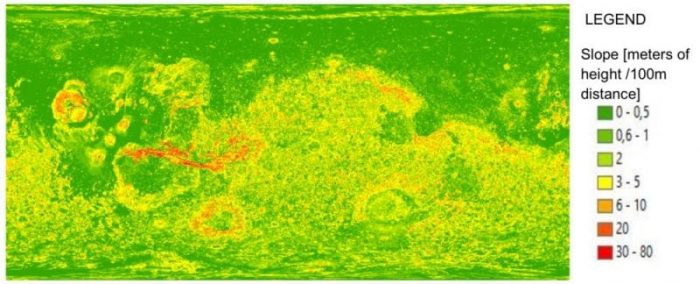
- The terrain with a slope of land below 5/ 100m
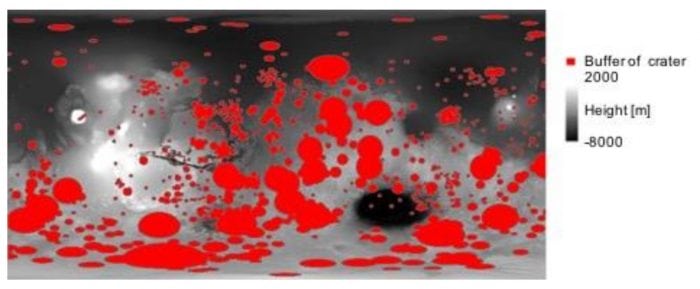
- The distance from volcanic craters depending on their diameter +20km
- Dust/sand storms: the wavelength sensing lack of dust in the range of 0.94 – 1.00 µm
In the studies, we have the data obtained by means of unmanned space missions (probes and satellites) with use of GIS (Geographic Information System) software. GIS software was used because it allows linking and advanced processing of raster and vector database data. The main tools that were used were those for processing raster data and performing spatial analysis.
Potential colony areas should be quite flat and characterized by low height differences of land. The project required to use the digital terrain model created for the surface of the planet. To find such areas, an analysis of DTM designating drop s of land on the Martian surface was conducted. Finally, maps of inclinations were created, with pixel values reflecting the slope at each given point.

Credit: Marta Kuźma
Another analysis was conducted to select areas where there are appropriate thermal conditions for settlement. In the analysis of the areas suitable for colonization and human life, those areas where the adjustment range of temperature is between – 30 and 30 ° C were selected. The analysis demonstrated that terrain formation affects the differentiation of temperatures in the atmosphere, as expected.

Credit: Marta Kuźma
The distance from volcanic craters depending on their diameter + 20km. Based on the images and the available data, we created a structure of a database, including objects such as craters, volcanoes, canyons, geographic regions and landing sites of Mars rovers. Each object in the database is characterized by the following data : Number of object, Object Code, Longitude, Latitude, Name, Description and date of discovery (for craters, volcanoes, canyons, geographical regions), Date of landing on Mars (for rover landing sites), The diameter (for craters, volcanoes), Surface area (applies to canyons, geographical regions). And we added the buffer around objects, it shows this figure.

Credit: Marta Kuźma
And the last data was connected with dust and sandstorms. We have taken into account the intensity of dust storms and the volume of moving rock dust inside the Martian atmosphere. This was enabled by analyzing the imaging of the entire planet created in the thermal infrared channel. These areas are marked in yellow, orange and red on the grid. On the other hand, areas free of the occurrence of this phenomenon were marked in blue.
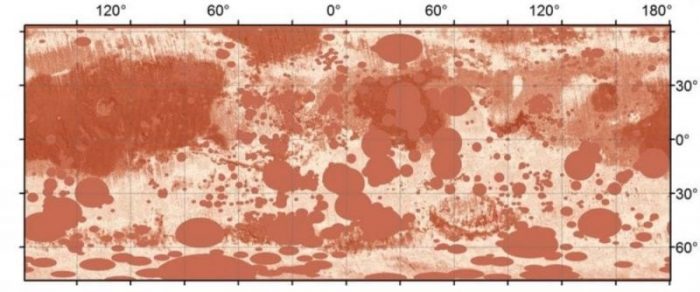
The obtained maps showing the various subfactors were then combined to create overlays. The final result of the analysis is the map, which shows the location of land suitable for colonization.

Credit: Marta Kuźma
The ultimate result was a map where sites of favorable conditions for settlement are marked in the lighter shade of brown. The result obtained after determining the adopted colonization limit and calculating the size of the area demonstrates that 43% of the surface of Mars could potentially be inhabited by humans. This is three times more than the surface area of the continent of South America.
More often it tell s about an exploration of the universe for colonization and finding mineral resources. GIS software, the analysis could help it.
This study, Applications of GIS in Analysis of Mars was recently published in the journal Proceedings of GIS Ostrava.


